Why SMBs Need Proactive IT Monitoring
Most small and midsize businesses find out their IT has failed the same way: an employee cannot work, calls the help desk, and only then does anyone start looking for the cause.
- Content owner
- Insyto Content Team
- Editorial reviewer
- Ritesh Mhatre
- Technical reviewer
- Navish Ansari
- Next review
- To be scheduled
- Last reviewed
- Review pending
- Technical level
- Intermediate · IT operations leaders, platform engineers
Executive Summary
Most small and midsize businesses find out their IT has failed the same way: an employee cannot work, calls the help desk, and only then does anyone start looking for the cause. By that point the failure has already cost money — in lost productivity, emergency labor, and sometimes lost data or a security breach. This is the reactive, break-fix model, and it is expensive precisely because it waits for damage before it acts. Proactive IT monitoring inverts it. Instead of waiting for something to break, monitoring watches the whole environment continuously, compares it against defined healthy thresholds, and raises an alert the moment a metric drifts toward trouble — usually before a single user notices.
The business case is not subtle. Industry estimates put the cost of downtime for a small business somewhere between roughly $5,600 and $22,000 per hour depending on the systems affected, and the reactive break-fix cycle typically costs two to five times more than proactive management once emergency labor, downtime, and secondary damage are counted. Organizations that move to a proactive model report dramatic reductions in serious incidents. Monitoring is, in effect, an insurance policy that also lowers your premiums: it prevents the expensive failures and makes the cost of IT predictable.
This guide explains why proactive monitoring matters for an SMB, exactly what a monitoring program should watch and at what thresholds, how an alert becomes a resolved issue, and how the whole thing is measured and owned. It is written for the leaders who fund IT, with detailed tables of the signals, thresholds, and metrics that make monitoring concrete rather than abstract. It is deliberately technology-agnostic — the discipline applies whatever tools you run — and complements the companion patch management and IT health assessment guides.
Who should read this:
- CIOs, CTOs, and IT directors accountable for uptime and risk
- Business owners weighing the cost of downtime against the cost of monitoring
- IT and operations managers running or buying a monitoring service
- Finance leaders comparing reactive and proactive IT cost models
What is the difference between reactive and proactive IT?
The distinction is simple but decisive: reactive IT responds to failures after they happen, while proactive monitoring detects the conditions that lead to failure and acts before the impact. The same disk filling up is, in the reactive world, a server crash discovered by users on Monday morning; in the proactive world, it is a low-priority alert cleared quietly on Friday afternoon.
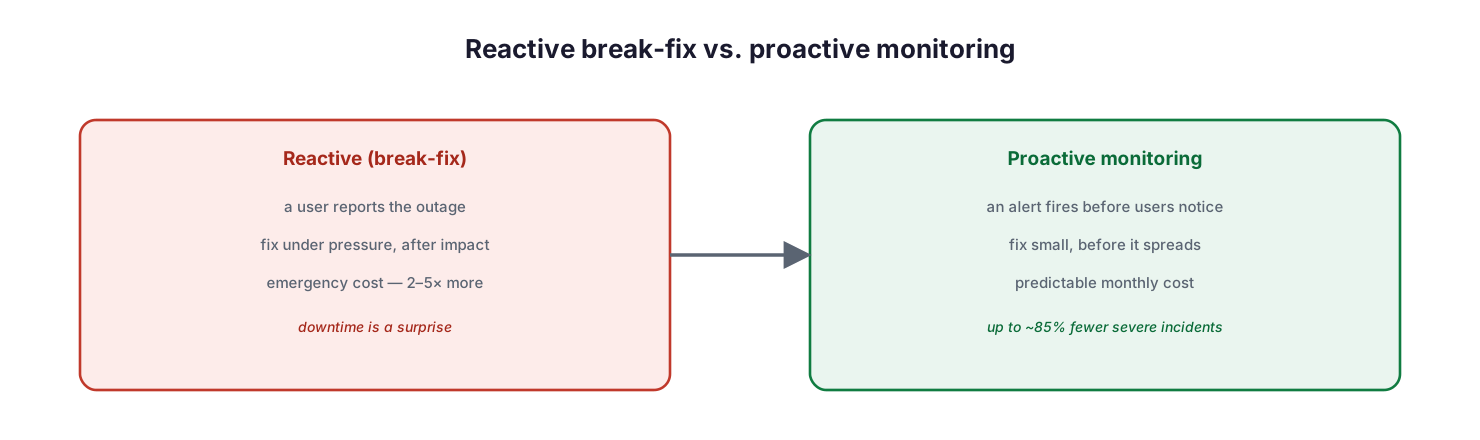
Reactive break-fix versus proactive monitoring: reactive waits for a user to report the outage and fixes it under pressure at 2–5× the cost, while proactive fires an alert before users notice, fixes issues while they are small at a predictable monthly cost, and yields up to about 85% fewer severe incidents.
| Dimension | Reactive (break-fix) | Proactive monitoring | Why it matters to the business |
|---|---|---|---|
| How issues are found | A user reports it after the outage | An alert fires before users are affected | Downtime is avoided, not just repaired |
| When you act | After failure, under pressure | At the first warning sign | A small fix instead of a major outage |
| Cost profile | Emergency labor, overtime, lost revenue — 2–5× more | Predictable fixed monthly fee | Lower and more forecastable total cost |
| Visibility & data | No history; each issue is a surprise | Baselines, trends, and capacity forecasts | Informed planning, not guesswork |
| Security posture | Breaches often discovered late | Anomalies flagged in real time | Smaller blast radius, faster containment |
| Business outcome | Outages recur and disrupt | Up to ~85% fewer severe incidents | Reliability, reputation, and trust |
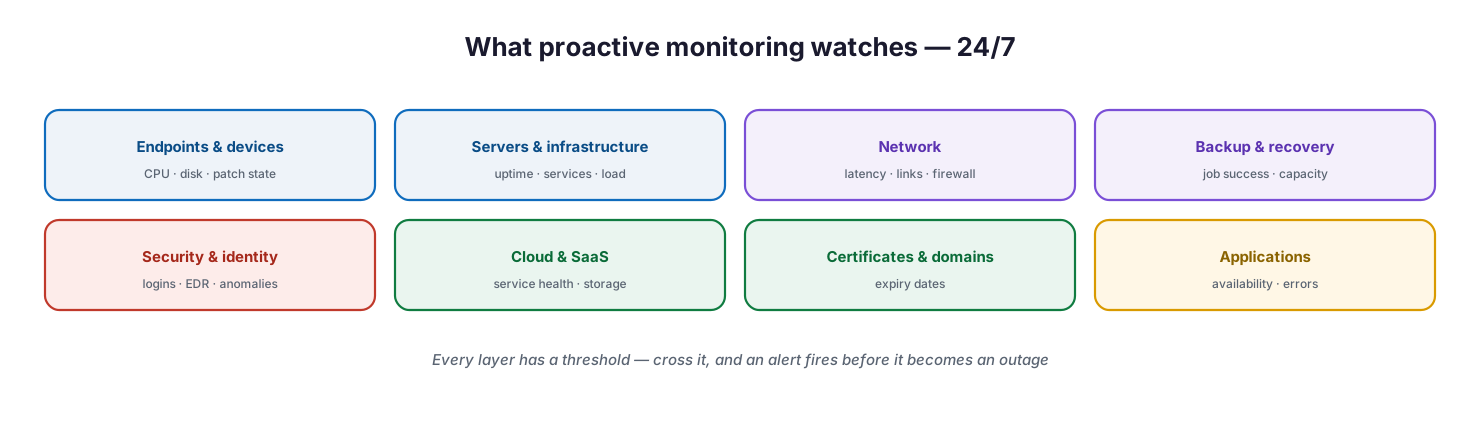
The cost of not monitoring: SMB downtime is estimated at roughly $5,600–$22,000 per hour, break-fix costs 2–5× more than proactive management, and proactive monitoring is associated with about 85% fewer severe incidents — industry estimates that vary by business but point consistently in one direction.
What should a monitoring program watch?
“Monitoring” is only meaningful if it covers the whole estate and knows what “unhealthy” looks like for each part. A credible program watches every layer 24/7 and has a defined threshold that turns a raw metric into an actionable alert. The table below is the substance of a monitoring program — the layers, the specific signals, and example thresholds that trigger action.
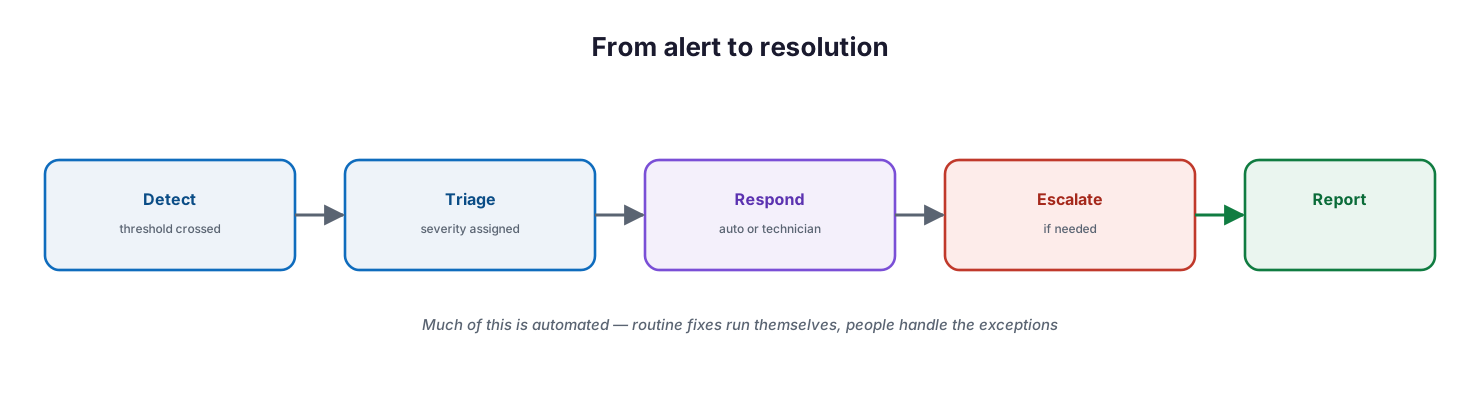
What proactive monitoring watches 24/7: endpoints and devices (CPU, disk, patch state), servers and infrastructure (uptime, services, load), network (latency, links, firewall), backup and recovery (job success, capacity), security and identity (logins, EDR, anomalies), cloud and SaaS (service health, storage), certificates and domains (expiry), and applications (availability, errors).
| Layer | Signals monitored | Example alert threshold | Tool category | Risk if unmonitored |
|---|---|---|---|---|
| Endpoints & devices | CPU, memory, disk health, patch status, online state | Disk >85% full; device offline >24h; patching >30 days behind | RMM | Device failure, malware, data loss |
| Servers & infrastructure | Uptime, critical services, CPU/RAM/disk, temperature | CPU >90% for 15 min; a critical service stopped | RMM / monitoring | Application and business outages |
| Network | Latency, packet loss, WAN/ISP link, firewall, VPN | Latency >150 ms; circuit down; VPN tunnel dropped | Network monitoring | Loss of connectivity |
| Backup & recovery | Job success/failure, restore test, repository capacity | Backup job failed or skipped; repository >90% full | Backup monitoring | Unrecoverable data |
| Security & identity | Failed logins, EDR alerts, risky sign-ins, config drift | >10 failed logins/min; high-severity EDR alert | SIEM / EDR | Breach, ransomware |
| Cloud & SaaS | Service health, mailbox/storage, license usage | Service degraded; storage >90%; licenses exhausted | Cloud monitoring | Productivity disruption |
| Certificates & domains | Certificate and domain expiry dates | Certificate or domain expiring in <30 days | Monitoring | Sudden, wholly avoidable outage |
A critical point: default thresholds from any monitoring tool are a starting point, not a finished configuration. Tuning them to the business — so alerts are meaningful and rare — is what separates a useful program from one that drowns the team in noise.
How does an alert become a resolved issue?
Detecting a problem is only valuable if it leads to a fast, reliable fix. A mature monitoring service runs a defined path from alert to resolution, with much of it automated so routine problems never reach a human.
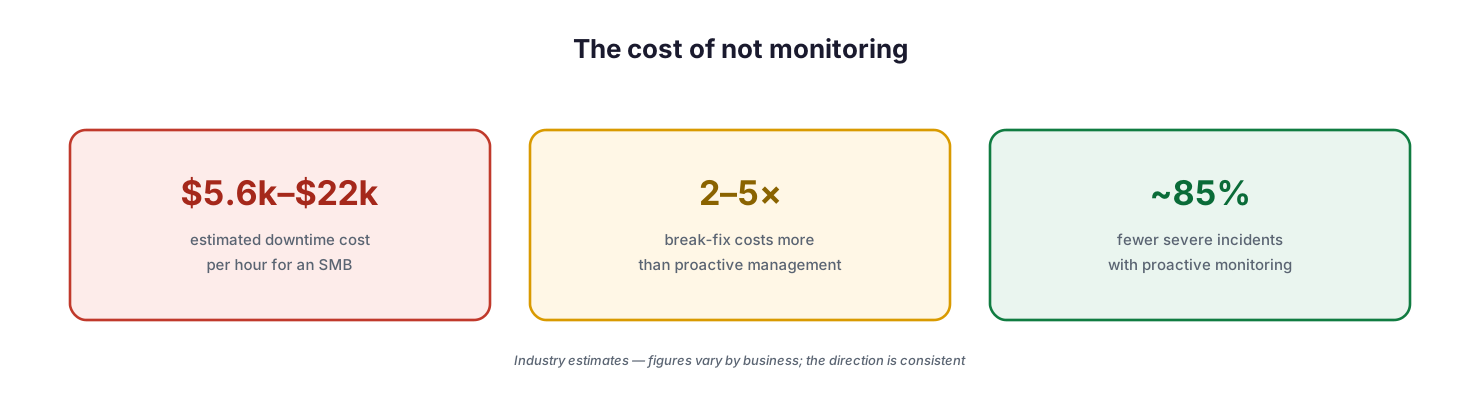
From alert to resolution: detect when a threshold is crossed, triage to assign severity, respond with automation or a technician, escalate if needed, and report — with much of the routine work automated.
| Stage | What happens | Example | Tool | Target time | Outcome |
|---|---|---|---|---|---|
| Detect | A signal crosses its threshold and an alert is generated | Disk hits 90% full | RMM / monitoring | Real-time | Alert raised |
| Triage | Severity and priority are assigned automatically or by an analyst | Classified as a P2 warning | PSA / ITSM | ≤15 minutes | Prioritized queue |
| Respond | Automated remediation runs, or a technician acts | Temp files cleared; volume expanded | RMM / automation | Within SLA | Issue resolved |
| Escalate | A specialist or the customer is engaged if needed | Failing disk → hardware replacement | On-call / vendor | Per SLA | Contained safely |
| Report | Trends, SLA performance, and posture are reported | Monthly service review | Dashboard / vCIO | Monthly | Governance and planning |
Automation is what makes this affordable at SMB scale: a disk-space alert can trigger a cleanup script, a stopped service can be restarted automatically, and only the genuine exceptions consume skilled time.
How is proactive monitoring measured?
Monitoring should be held to numbers, not vibes. The metrics below tell leadership whether the service is actually preventing problems and resolving them quickly — each one a direct proxy for uptime, risk, or cost.
| Metric | What it measures | Healthy target | Red flag | Business value |
|---|---|---|---|---|
| Availability / uptime | Percentage of time critical systems are up | ≥99.9% | <99% | Business continuity |
| Mean time to detect (MTTD) | Average time from issue onset to alert | Minutes | Hours or unknown | Faster response |
| Mean time to resolve (MTTR) | Average time from alert to fix | Within SLA (e.g., ≤4h for P1) | Days | Less downtime |
| Actionable-alert ratio | Share of alerts that require real action | ≥80% | <50% | Less alert fatigue, focus on real issues |
| Backup success rate | Percentage of successful backup jobs | ≥99% | <95% | Recoverability assured |
| Proactive catch rate | Share of issues fixed before user impact | ≥70% | <30% | Fewer incidents, higher trust |
Who owns monitoring, and how is it governed?
Monitoring only delivers when it is somebody’s standing job, with clear ownership, tooling, and cadence. Whether run in-house or by a managed provider, the accountable owner is the CIO, and the provider (or internal team) is responsible for operating it to an agreed service level.
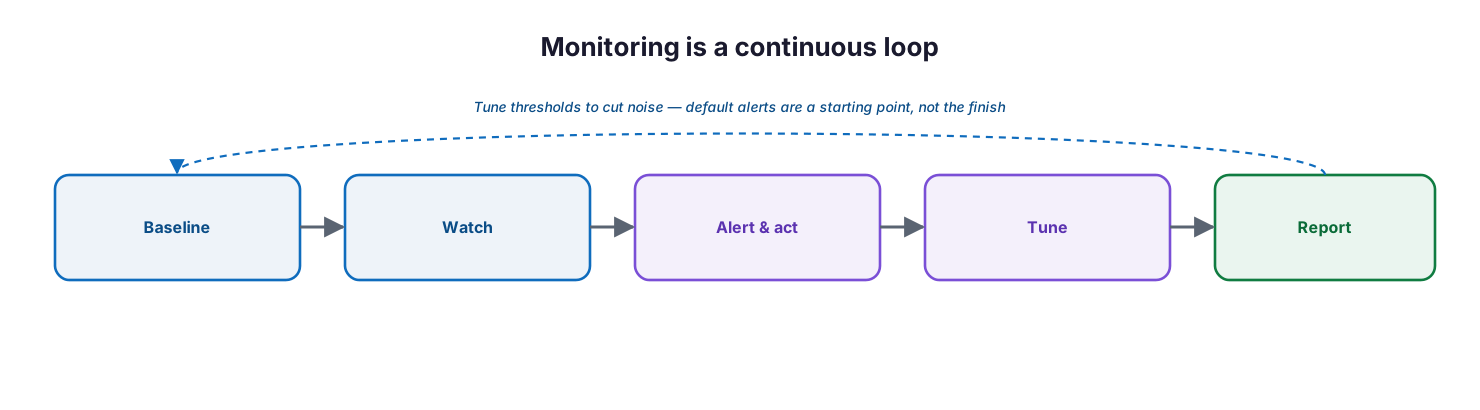
Monitoring is a continuous loop: baseline the environment, watch it against thresholds, alert and act when they are crossed, tune the thresholds to cut noise, and report — tuning continuously because default alerts are a starting point, not the finish.
| Service area | Activity | Responsible (MSP/IT) | Accountable (CIO) | Tool | Cadence | SLA / impact |
|---|---|---|---|---|---|---|
| Coverage | Deploy agents; baseline every layer | MSP / IT ops | CIO | RMM / monitoring | On onboarding | No blind spots |
| Detection | Watch signals; maintain thresholds | MSP SOC / NOC | CIO | RMM / SIEM | 24/7 | Issues caught early |
| Response | Remediate alerts, automate routine fixes | MSP / IT ops | CIO | RMM / automation | Within SLA | Fast resolution |
| Tuning | Reduce false positives; refine thresholds | MSP / IT ops | CIO | Monitoring platform | Monthly | Signal over noise |
| Reporting | Report uptime, incidents, trends | MSP vCIO | CIO | Dashboard | Monthly | Governance and cost control |
Implementation checklist
- Every layer is monitored — endpoints, servers, network, backup, security, cloud, certificates
- Each monitored signal has a defined, business-tuned alert threshold
- Monitoring runs 24/7, not just during business hours
- Alerts flow into a triage process with assigned severities
- Routine responses are automated to reduce time and cost
- Escalation paths to specialists and the customer are defined
- Backup jobs and restore tests are monitored, not assumed
- Security and identity signals feed detection, not just performance metrics
- Metrics (uptime, MTTD, MTTR, catch rate) are baselined and reported
- The CIO owns monitoring; the provider or team operates it to an SLA
- Thresholds are tuned regularly to keep alerts meaningful
Best practices
- Monitor the whole estate; the layer you skip is where the next outage starts.
- Define healthy thresholds per signal, and tune them so alerts are rare and real.
- Run monitoring 24/7 — failures do not wait for business hours.
- Automate routine remediation so people handle only the exceptions.
- Monitor backups and restore tests explicitly, not just infrastructure.
- Include security and identity signals, not only performance.
- Measure the service — uptime, MTTD, MTTR, and proactive catch rate.
- Report trends to leadership so monitoring drives planning and budget.
- Treat it as a continuous loop; re-tune thresholds as the environment changes.
Common mistakes
- Staying reactive and paying 2–5× more for emergency fixes.
- Monitoring only servers while endpoints, backups, and certificates go unwatched.
- Leaving default thresholds in place, generating noise nobody trusts.
- Alert fatigue — so many false positives that real alerts are missed.
- Monitoring during business hours only, missing overnight failures.
- Assuming backups work because the job exists, without monitoring outcomes.
- Collecting alerts with no triage, automation, or defined response.
- Never reporting, so monitoring’s value stays invisible to leadership.
Frequently asked questions
What is proactive IT monitoring?
It is the continuous, 24/7 watching of an IT environment against defined healthy thresholds, so that problems are detected and addressed before they cause downtime or damage — the opposite of the reactive, break-fix model that waits for failures.
How is it different from break-fix support?
Break-fix responds after something has already failed, usually at emergency cost. Proactive monitoring detects the warning signs and acts first, preventing many failures entirely and making IT cost predictable rather than a series of surprises.
What does monitoring actually watch?
The whole estate: endpoints, servers and infrastructure, network, backup systems, security and identity signals, cloud and SaaS services, applications, and certificate and domain expiry — each with thresholds that turn a metric into an actionable alert.
Isn’t monitoring just noise and false alarms?
It can be if left on default settings. The discipline is tuning thresholds to the business so alerts are meaningful and rare, and using automation and triage so only genuine issues reach a person. A high actionable-alert ratio is a sign of a healthy program.
What does it cost, and is it worth it?
Monitoring is a predictable monthly cost, typically far below the cost of the downtime it prevents — with SMB downtime estimated in the thousands of dollars per hour and break-fix costing several times more than proactive management. It usually pays for itself by avoiding a single serious outage.
How is monitoring measured?
Through availability/uptime, mean time to detect and resolve, the share of alerts that are actionable, backup success, and the proportion of issues caught before users are affected — reported to leadership on a cadence.
Can a small business run this itself?
Some can, with the right tools, but most SMBs get better coverage and 24/7 response from a managed provider that already operates monitoring at scale. Either way, the CIO owns the outcome and the service runs to a defined SLA.
Conclusion
Proactive IT monitoring is the difference between finding out your systems have failed from an angry employee and knowing about a developing problem before anyone else does. The economics are decisive: downtime is expensive, break-fix is more expensive still, and monitoring both prevents the failures and makes the cost of IT predictable. But the value only materializes when monitoring is done properly — covering every layer, with thresholds tuned to the business, automation handling the routine, and clear metrics proving it works.
The path forward is concrete: monitor the whole estate against defined thresholds, run it around the clock, automate routine response, measure uptime and resolution times, and report the results to leadership. Treated as a continuous, owned, and tuned discipline rather than a switch to flip, proactive monitoring turns IT from a source of costly surprises into a quietly reliable foundation the business can grow on. For the related disciplines, see the companion patch management and IT health assessment guides.
References
This is a vendor-neutral overview of proactive IT monitoring. The following industry sources inform the figures and practices; verify current data for your context. Source access date: 28 July 2026.
On this page
- Executive Summary
- What is the difference between reactive and proactive IT?
- What should a monitoring program watch?
- How does an alert become a resolved issue?
- How is proactive monitoring measured?
- Who owns monitoring, and how is it governed?
- Implementation checklist
- Best practices
- Common mistakes
- Frequently asked questions
- Conclusion
- References