Server Monitoring Best Practices: Golden Signals, the USE Method, and Alerting That Works
Servers rarely fail without warning.
- Content owner
- Insyto Content Team
- Editorial reviewer
- Ritesh Mhatre
- Technical reviewer
- Navish Ansari
- Next review
- To be scheduled
- Last reviewed
- Review pending
- Technical level
- Intermediate · IT directors, network and infrastructure teams
Executive Summary
Servers rarely fail without warning. Disks fill gradually, memory pressure builds, latency creeps up, and error rates tick higher long before an outage takes down a business-critical application. The organizations that avoid unplanned downtime are not the ones with the most sensors — they are the ones watching the right signals and turning them into action before customers feel the impact. Server monitoring is the discipline that makes this possible: collecting, aggregating, and displaying quantitative data about how systems behave, and alerting a human when something is broken or about to break.
Yet most monitoring setups fail in one of two predictable ways. Some collect too little, so problems surface only when a user complains. Far more collect too much — hundreds of metrics wired to hundreds of alerts — until the noise drowns the signal, engineers grow numb to their pagers, and the one alert that mattered is skimmed and ignored. The goal is not maximum data; it is maximum insight for minimum effort, built on a small set of proven principles that apply regardless of whether you run a handful of servers or a data center.
This article distills the field’s most durable, vendor-neutral guidance into a practical framework. It draws on the four golden signals popularized by Google’s Site Reliability Engineering practice — latency, traffic, errors, and saturation — and on the USE method developed by performance engineer Brendan Gregg, which checks utilization, saturation, and errors for every resource. It covers the difference between black-box and white-box monitoring, the critical distinction between symptoms and causes, how to set alert thresholds that stay quiet until they matter, and how to route events by urgency so a page always means “act now.” The aim is a monitoring program that is simple enough to reason about, comprehensive enough to catch real problems, and disciplined enough that every alert earns the interruption it causes.
Why Monitor in the First Place
Before choosing what to measure, it is worth being clear about why. Monitoring serves several distinct purposes, and a setup built for only one of them leaves value on the table.
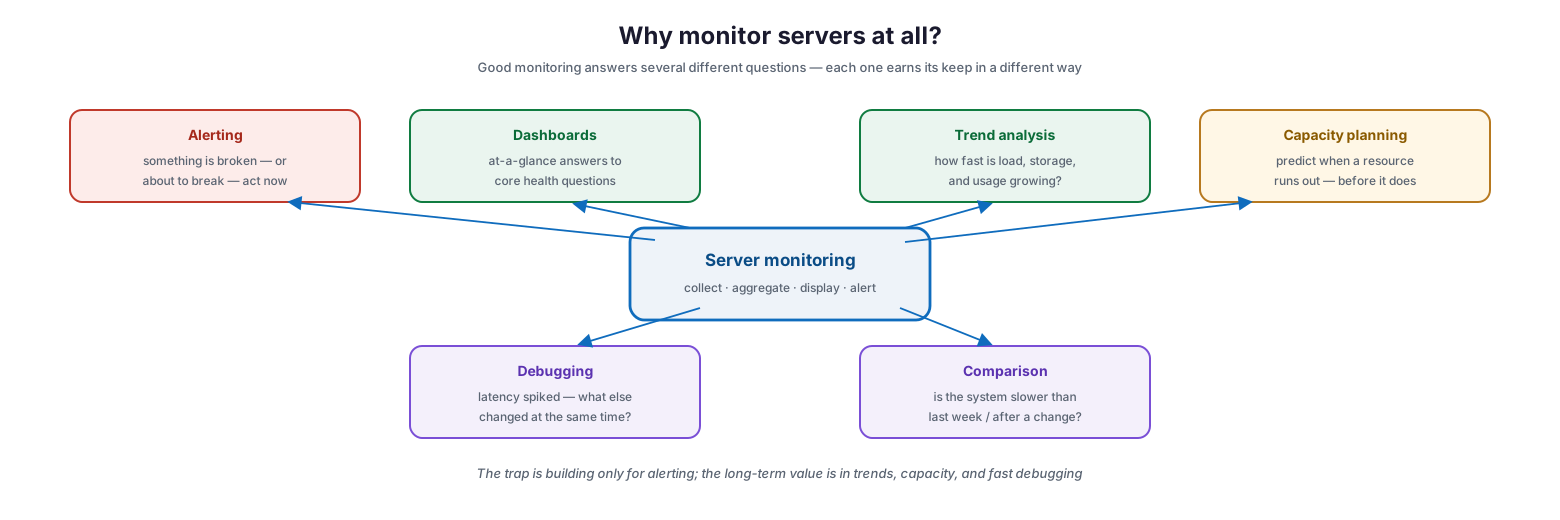
Why monitor servers at all?
The most visible purpose is alerting: something is broken and someone must fix it now, or something looks likely to break soon. But monitoring also powers dashboards that answer basic health questions at a glance, trend analysis that reveals how load, storage, and usage are growing over months, capacity planning that predicts when a resource will run out before it actually does, and ad hoc debugging that lets an engineer ask “our latency just spiked — what else changed at the same time?” It supports comparison too: is the system slower than it was last week, or after the last deployment? The common trap is building only for alerting and neglecting the rest. The long-term payoff of monitoring lies as much in trends, capacity forecasting, and fast root-cause analysis as in the pager going off.
| Purpose | Question it answers | Typical output |
|---|---|---|
| Alerting | What is broken, or about to break, right now? | Page or ticket |
| Dashboards | Is the service healthy at a glance? | Prebuilt metric views |
| Trend analysis | How fast are load and data growing? | Long-horizon graphs |
| Capacity planning | When will a resource run out? | Forecasts and projections |
| Debugging | What changed when the problem started? | Correlated metric history |
| Comparison | Is it slower than before or after a change? | Before/after analysis |
The Four Golden Signals
When monitoring a user-facing service, the single most useful starting point is the set of four golden signals. The guidance is deliberately blunt: if you can only measure four things about your system, measure these.
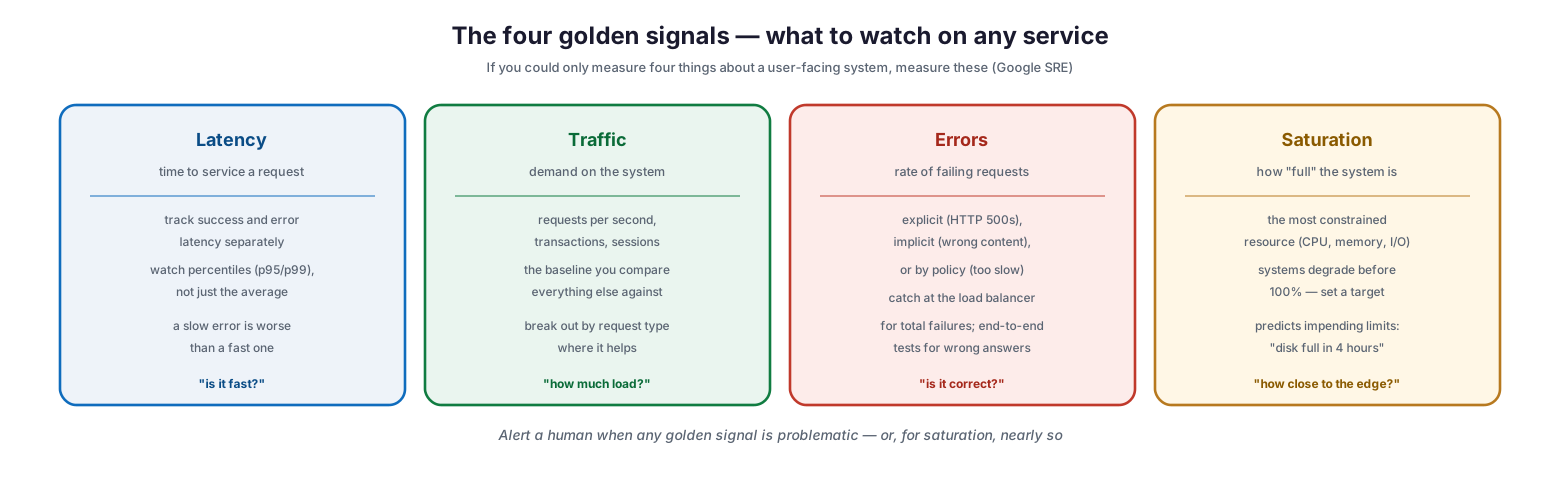
The four golden signals — what to watch on any service
Latency is the time it takes to service a request, and it must be tracked separately for successful and failed requests — a fast error is bad, but a slow error is worse, and averaging the two hides both. Traffic measures the demand placed on the system, usually requests per second, transactions, or concurrent sessions; it is the baseline against which everything else is interpreted. Errors is the rate of requests that fail, whether explicitly (an HTTP 500), implicitly (a success code returned with the wrong content), or by policy (a response that exceeded your latency commitment). Saturation captures how “full” the system is, focused on the most constrained resource — because most systems degrade well before they hit 100 percent utilization, and saturation can even forecast trouble, as in “this database will fill its disk in four hours.” Instrument all four, alert when any becomes problematic (or, for saturation, nearly so), and a service is decently covered.
| Signal | Measures | Watch for | Example alert |
|---|---|---|---|
| Latency | Time to service a request | Rising p95/p99, slow errors | p99 over 1s for 5 minutes |
| Traffic | Demand on the system | Sudden drops or spikes | Request rate falls 50% |
| Errors | Rate of failing requests | Any sustained increase | Error rate over 1% |
| Saturation | Fullness of key resources | Approaching utilization limits | Disk over 85%, CPU queue growing |
A related discipline is to watch the tail, not the mean. A service averaging 100 ms can still serve one percent of requests in five seconds, and for users those slow requests are the experience that matters. Collecting request counts bucketed into latency ranges — a histogram — and tracking high percentiles reveals the tail that averages conceal.
The USE Method for Resources
The golden signals describe a service from the outside; the USE method examines the machine’s resources from the inside. Its summary is a single sentence: for every resource, check utilization, saturation, and errors. Applied as a checklist, it identifies systemic bottlenecks quickly — reportedly solving around 80 percent of server issues with a small fraction of the effort.
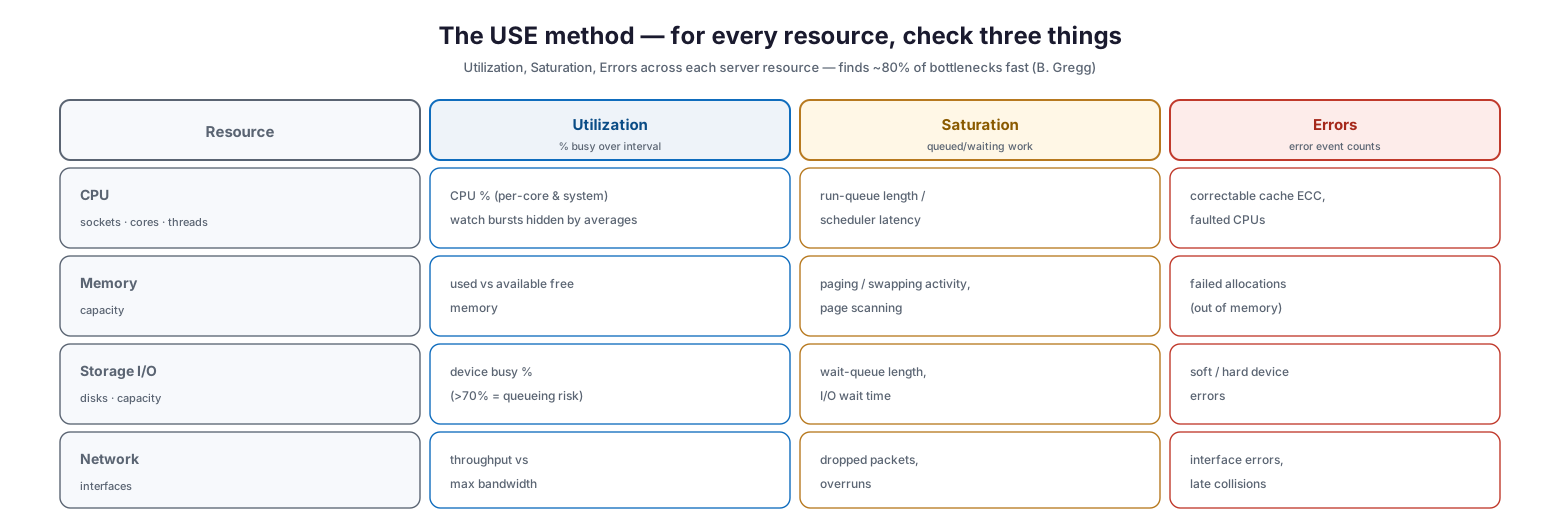
The USE method — for every resource, check three things
The method starts from a list of physical resources — CPUs, memory, network interfaces, storage devices, controllers, and interconnects — and asks the same three questions of each. Utilization is the average time the resource was busy, expressed as a percentage. Saturation is the degree to which the resource has extra work it cannot service, usually queued, expressed as a queue length. Errors are the count of error events. The power of the approach is that it begins with questions rather than with whatever metrics happen to be available, so it exposes the gaps — the “known unknowns” — that a tool-first approach leaves invisible.
| Resource | Utilization | Saturation | Errors |
|---|---|---|---|
| CPU | CPU busy % (per-core and system) | Run-queue length, scheduler latency | Correctable cache ECC, faulted CPUs |
| Memory | Used vs available free memory | Paging/swapping, page scanning | Failed allocations (out of memory) |
| Storage I/O | Device busy % | I/O wait-queue length | Soft/hard device errors |
| Network | Throughput vs max bandwidth | Dropped packets, overruns | Interface errors, late collisions |
Interpretation matters as much as measurement. High utilization — beyond roughly 70 percent — begins to cause queueing delays on resources that cannot be interrupted mid-operation, such as disks. Any non-zero saturation is worth investigating, since it means work is waiting. And non-zero, still-increasing error counters during poor performance are a strong signal. Crucially, low average utilization does not rule out saturation: a resource can average 80 percent over five minutes while hitting 100 percent for seconds at a time, producing latency spikes that coarse averages completely hide.
Black-Box, White-Box, and the Symptom/Cause Split
Two conceptual lenses shape a good monitoring program, and mature setups use both deliberately.
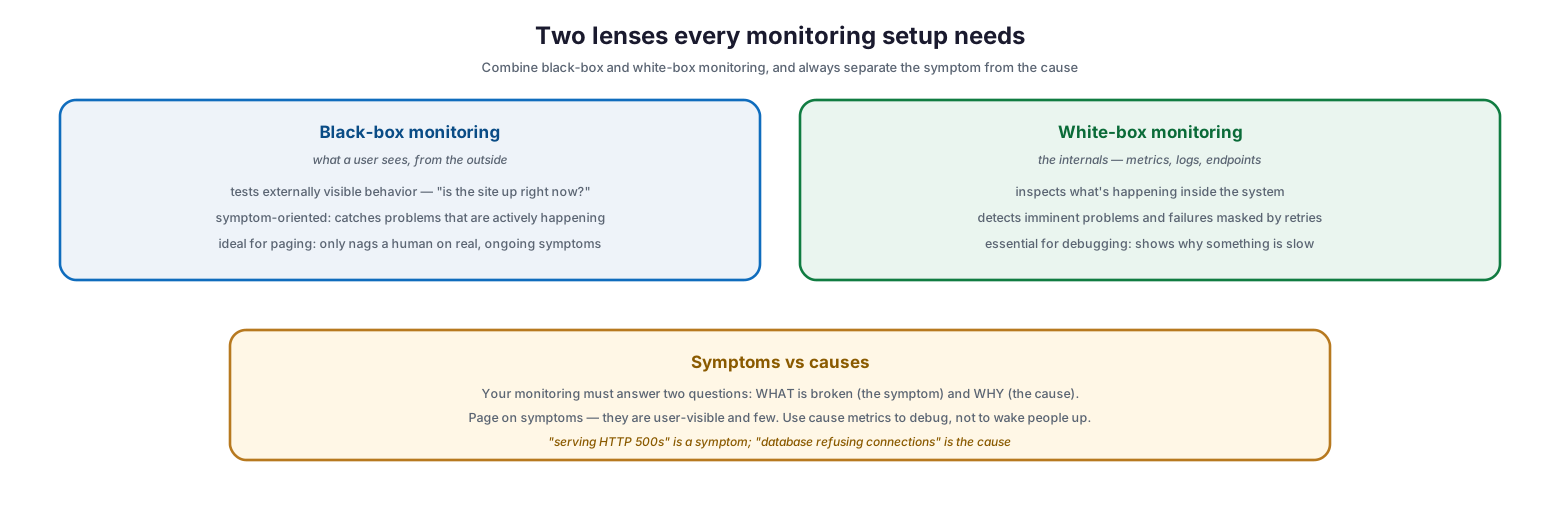
Two lenses every monitoring setup needs
Black-box monitoring tests externally visible behavior the way a user experiences it — “is the site working right now?” It is symptom-oriented and represents active, not predicted, problems, which makes it ideal for paging because it only interrupts a human when something is genuinely and currently wrong. White-box monitoring inspects the internals through metrics, logs, and instrumented endpoints; it can detect imminent problems and failures masked by retries, and it is essential for debugging because it shows why a system is slow, not just that it is. A robust program combines heavy white-box instrumentation with modest but critical black-box checks.
Running through both is the distinction between symptoms and causes — arguably the most important idea in writing good alerts. A symptom is what is broken from the user’s perspective (“we are serving HTTP 500s”); a cause is why (“the database is refusing connections”). Note that in a layered system one person’s symptom is another’s cause: slow database reads are a symptom to the database team and a cause to the front-end team. The practical rule is to page on symptoms, because they are user-visible and comparatively few, and to reserve cause-oriented metrics for debugging rather than for waking people up.
Alerting With High Signal and Low Noise
Collecting the right metrics is only half the job; the other half is deciding what deserves a human’s attention and through which channel. This is where most monitoring programs quietly fail, because paging a person is expensive — it interrupts focused work or personal time — and when pages come too often, engineers begin to second-guess, skim, or ignore them, sometimes missing a real alert masked by the noise.
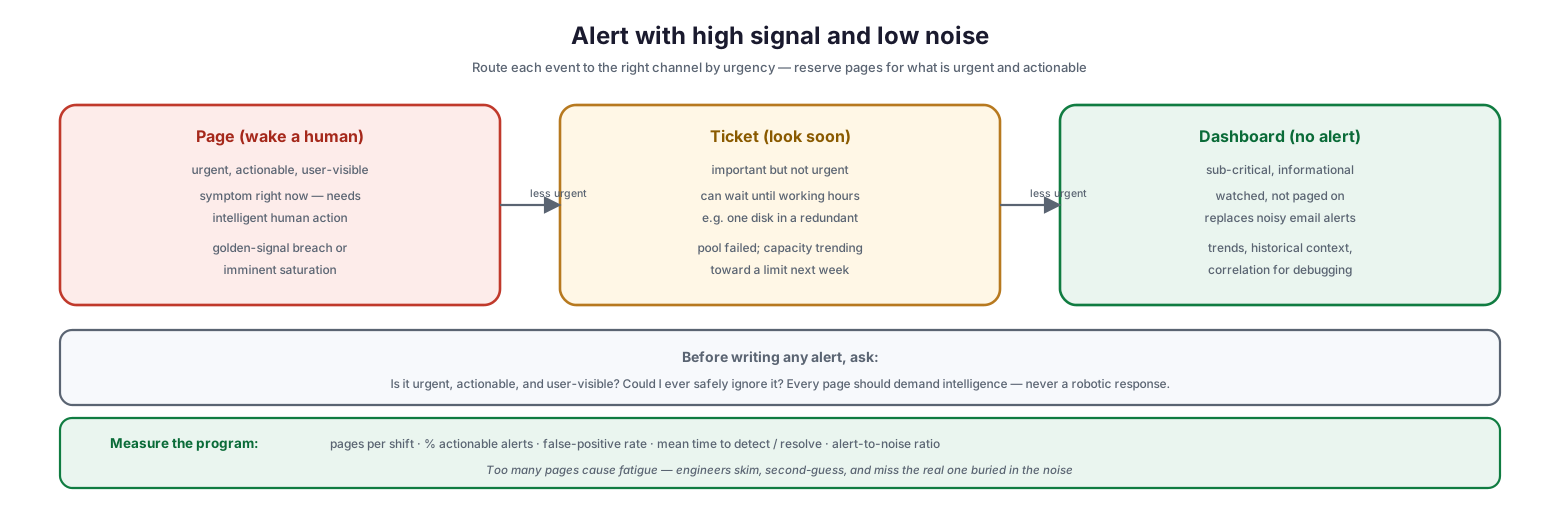
Alert with high signal and low noise
The remedy is to route events by urgency. A page — waking a human — is reserved for problems that are urgent, actionable, and user-visible, and that require intelligent human judgment; a golden-signal breach or imminent saturation qualifies. A ticket is for issues that are important but can wait until working hours, such as a single disk failing in a redundant pool, or a capacity trend heading toward a limit next week. Everything sub-critical belongs on a dashboard, watched but not alerted on, which also replaces the noisy email alerts that inevitably become ignored. Before writing any alert, ask whether it detects an otherwise-undetected condition that is urgent, actionable, and actively user-visible; whether it could ever be safely ignored; and whether it demands intelligence rather than a robotic, scriptable response. A page that merits only a rote reaction should be automated, not sent to a person.
| Channel | Urgency | Criteria | Example |
|---|---|---|---|
| Page | Act now | Urgent, actionable, user-visible symptom | Service returning errors, p99 latency breach |
| Ticket | Look soon | Important, not time-critical | Redundant disk failed, cert expiring in 10 days |
| Dashboard | Informational | Sub-critical, watched not paged | Utilization trends, historical correlation |
Sustained pager load is itself a metric to manage. If an alert fires often with a predictable, scriptable response, that is a signal to fix the underlying cause or automate the response — not to keep paging a human indefinitely.
Choosing Resolution and Keeping It Simple
Two practical constraints round out a healthy monitoring design. First, resolution should match the question. Measuring CPU load once a minute will miss the short spikes that drive tail latency, while probing a website’s success status more than once or twice a minute is wasteful for a service targeting 99.9 percent availability. Where high resolution is needed without high cost, sample frequently on the server and aggregate — for example, bucketing per-second CPU readings and summarizing per minute — to catch brief hotspots affordably.
Second, favor simplicity. The rules that catch real incidents most often should be the simplest, most predictable, and most reliable. Signals that are collected but never shown on a dashboard or used in an alert are candidates for removal, as are alerting rules that fire so rarely they are never exercised. Monitoring, like any software, can grow so complex that it becomes fragile and a maintenance burden in its own right. The most valuable monitoring system is one the whole team can understand and reason about, especially on the critical path from a production problem, through a page, to diagnosis and fix.
Server Monitoring Checklist
- Instrument the four golden signals — latency, traffic, errors, saturation — on every user-facing service.
- Track success and error latency separately, and watch high percentiles (p95/p99), not just averages.
- Apply the USE method to each resource: utilization, saturation, and errors for CPU, memory, disk, and network.
- Treat utilization above ~70% on non-interruptible resources as a warning, and any non-zero saturation as worth investigating.
- Combine black-box checks (external, symptom-oriented) with white-box metrics (internal, for debugging).
- Page on symptoms; reserve cause metrics for debugging dashboards.
- Route events by urgency: page for urgent/actionable, ticket for important-not-urgent, dashboard for informational.
- Ensure every page is urgent, actionable, user-visible, and demands human judgment; automate anything rote.
- Match measurement resolution to the question, sampling and aggregating to catch bursts affordably.
- Prune metrics and alerts that are never used or never fire; keep the system simple and comprehensible.
- Use monitoring data for capacity planning and trend analysis, not just alerting.
- Review pager load regularly and fix or automate the causes of recurring alerts.
Best Practices
Start with symptoms, add causes for context. Build your paging alerts around user-visible symptoms captured by the golden signals, then layer in cause-oriented white-box metrics on dashboards to speed up diagnosis once you are already investigating.
Set targets, not just thresholds. Because systems degrade before full utilization, define what “healthy” looks like — a saturation target, an error budget, a latency objective — and alert against those, rather than waiting for a resource to hit 100 percent.
Watch the tail. Averages lie about user experience. Use histograms and high percentiles so a slow tail of requests cannot hide behind a comfortable mean.
Protect the pager. Treat every page as a genuine interruption that must be worth it. Keep signal high and noise low, and move rote, scriptable responses into automation so humans are reserved for novel problems.
Keep it simple and reviewable. Prefer a small number of robust, well-understood rules over a sprawling web of fragile ones. Regularly remove unused metrics and stale alerts.
Feed the long game. Use the same data for capacity planning and trend analysis so monitoring prevents problems months out, not just minutes out.
Common Mistakes
Alerting on causes instead of symptoms. Paging on every internal cause produces noise and misses the user-visible failures that actually matter. Page on what users feel; debug with the rest.
Drowning in noise. Wiring hundreds of metrics to hundreds of alerts creates pager fatigue, and a fatigued engineer skims or ignores alerts — including the real one. Fewer, better alerts win.
Trusting averages. A healthy average CPU or latency figure can conceal damaging spikes and slow tails. Always look at bursts and percentiles.
Monitoring only for alerts. Neglecting trends and capacity planning means running blind to problems that build slowly, like storage growth, until they become emergencies.
Measuring at the wrong resolution. Sampling too coarsely misses short but harmful spikes; sampling too finely wastes storage and money. Match resolution to the question.
Letting the system sprawl. Unmaintained monitoring grows fragile and untrustworthy. Prune unused signals and rules, and keep the critical alerting path simple.
Frequently Asked Questions
What is the difference between the golden signals and the USE method? The golden signals (latency, traffic, errors, saturation) describe a service from the user’s perspective and are ideal for user-facing monitoring. The USE method (utilization, saturation, errors per resource) examines the machine’s internal resources and is ideal for finding hardware bottlenecks. They complement each other — use both.
Which metrics should a small business start with? Begin with the golden signals on your key services and the easy USE checks on each server: CPU utilization, memory usage, disk busy percentage and capacity, and network throughput. These catch the most common problems for the least effort.
What is a good utilization threshold? As a rule of thumb, utilization above about 70 percent on resources that cannot be interrupted mid-operation (like disks) is a warning sign, because queueing delays become frequent. But watch for bursts: a low average can still hide brief periods at 100 percent.
How do I avoid alert fatigue? Page only on urgent, actionable, user-visible symptoms; send important-but-not-urgent issues to tickets; and put everything informational on dashboards. Automate any alert with a rote response, and review pager load regularly.
Should I use black-box or white-box monitoring? Both. Black-box monitoring tests what users see and is best for paging on real, active problems. White-box monitoring inspects internals and is essential for debugging and catching imminent issues.
How often should I collect metrics? Match the resolution to the question. Fast-changing signals that drive tail latency may need per-second sampling (aggregated to control cost), while an availability probe once or twice a minute is enough for most services.
Conclusion
Effective server monitoring is not about collecting everything; it is about watching the few signals that reveal real problems and turning them into timely, actionable alerts. The four golden signals give you a service-level view — latency, traffic, errors, and saturation — while the USE method gives you a resource-level checklist of utilization, saturation, and errors for every component. Combine black-box and white-box perspectives, keep the symptom/cause distinction clear, and route every event by urgency so a page always means “a human must act now.”
Above all, protect the signal. A monitoring system that is simple, reviewable, and quiet until it matters is one the team will actually trust and act on. Start with the golden signals and the easy USE checks, alert on symptoms, prune relentlessly, and use the same data to plan capacity and spot trends. Do that, and monitoring stops being a wall of noisy graphs and becomes what it should be: an early-warning system that keeps the infrastructure — and the business that runs on it — reliably online.
References
- Google SRE Book — Monitoring Distributed Systems (Four Golden Signals)
- The USE Method — Brendan Gregg
- Google SRE Book — Practical Alerting
- Google SRE Book — Service Level Objectives
- Google SRE Workbook — Alerting on SLOs
- USE Method — Linux Performance Checklist
- Thinking Methodically about Performance (ACM Queue)
On this page
- Executive Summary
- Why Monitor in the First Place
- The Four Golden Signals
- The USE Method for Resources
- Black-Box, White-Box, and the Symptom/Cause Split
- Alerting With High Signal and Low Noise
- Choosing Resolution and Keeping It Simple
- Server Monitoring Checklist
- Best Practices
- Common Mistakes
- Frequently Asked Questions
- Conclusion
- References