Network Monitoring Guide: FCAPS, Key Metrics, and Building a Proactive Program
The network is the circulatory system of a modern business.
- Content owner
- Insyto Content Team
- Editorial reviewer
- Ritesh Mhatre
- Technical reviewer
- Navish Ansari
- Next review
- To be scheduled
- Last reviewed
- Review pending
- Technical level
- Intermediate · IT directors, network and infrastructure teams
Executive Summary
The network is the circulatory system of a modern business. Every application, phone call, file transfer, and cloud service depends on it, and yet in most small and mid-sized organizations the network is the least-watched part of the infrastructure — right up until it fails. When it does, the symptoms are maddeningly vague (“the internet is slow,” “the app keeps timing out,” “calls are breaking up”), the cause could be any of a hundred devices or links, and the business loses productivity by the minute while someone hunts for it. Network monitoring is the discipline that replaces that guesswork with visibility: continuous, structured observation of every device, link, and flow, so problems are seen — and often solved — before users feel them.
Unlike ad hoc troubleshooting, mature network monitoring rests on decades of standardized practice. The ISO and ITU-T codified the functions of network management into the FCAPS model — Fault, Configuration, Accounting, Performance, and Security — which remains the clearest way to think about what a monitoring program must cover. Beneath it sit well-established mechanisms: SNMP for polling device health, flow protocols for understanding traffic, packet capture for deep inspection, and synthetic tests for measuring the user experience. And a small, universal set of metrics — availability, latency, jitter, packet loss, bandwidth utilization, and errors — tells you, at any moment, whether the network is healthy.
This guide is a vendor-neutral, practical walkthrough of how to monitor a network well. It explains the FCAPS framework and where monitoring lives within it, the five data sources that reveal what the network is doing and the different questions each answers, the six metrics that define network health and how to baseline them, the difference between active and passive monitoring, and the maturity path from reactive firefighting to proactive and ultimately predictive operations. The goal is a monitoring program that shrinks mean-time-to-repair, catches issues before they become outages, and gives a growing business the same network reliability that large enterprises engineer for.
The FCAPS Framework
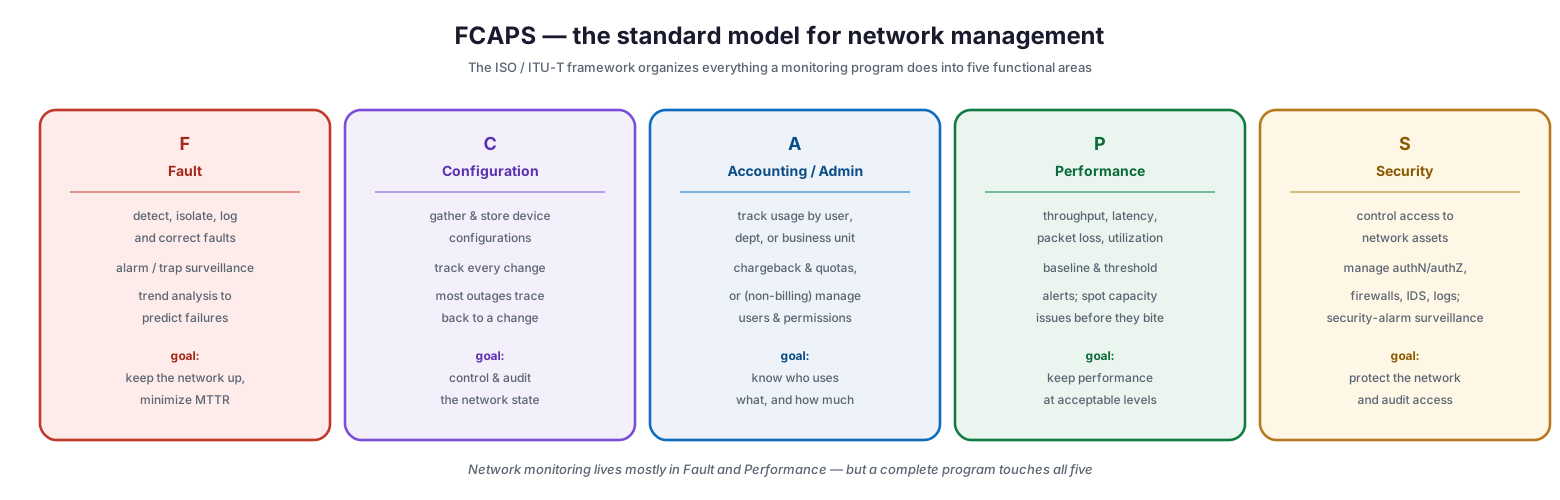
Before choosing tools or metrics, it helps to have a map of what network management actually encompasses. The ISO/ITU-T FCAPS model provides exactly that, dividing the work into five functional areas that together define a complete program.
FCAPS — the standard model for network management
Fault management is about recognizing, isolating, logging, and correcting faults — the alarm-and-trap surveillance that a network operations center revolves around — and using trend analysis to predict failures before they happen. Configuration management gathers and stores device configurations and, critically, tracks every change, since a large share of outages trace directly back to a configuration change, a software update, or a hardware swap. Accounting (or, in non-billing organizations, administration) tracks usage by user, department, or business unit for chargeback and quotas, or manages users and permissions. Performance management ensures the network runs at acceptable levels by measuring throughput, response times, packet loss, and utilization, and by setting thresholds that trigger alarms. Security management controls access to network assets, manages authentication, firewalls, and intrusion detection, and feeds security alarms into the same surveillance process as faults. Network monitoring lives most heavily in the Fault and Performance areas, but a genuinely complete program touches all five.
| FCAPS area | Focus | Monitoring role |
|---|---|---|
| Fault | Detect, isolate, correct faults | Alarm/trap surveillance, outage detection |
| Configuration | Track device config and changes | Change tracking, config drift detection |
| Accounting / Admin | Usage tracking, or user administration | Utilization reporting, capacity chargeback |
| Performance | Keep performance acceptable | Baselines, thresholds, capacity trends |
| Security | Control and audit access | Security-alarm surveillance, log review |
Five Ways to See the Network
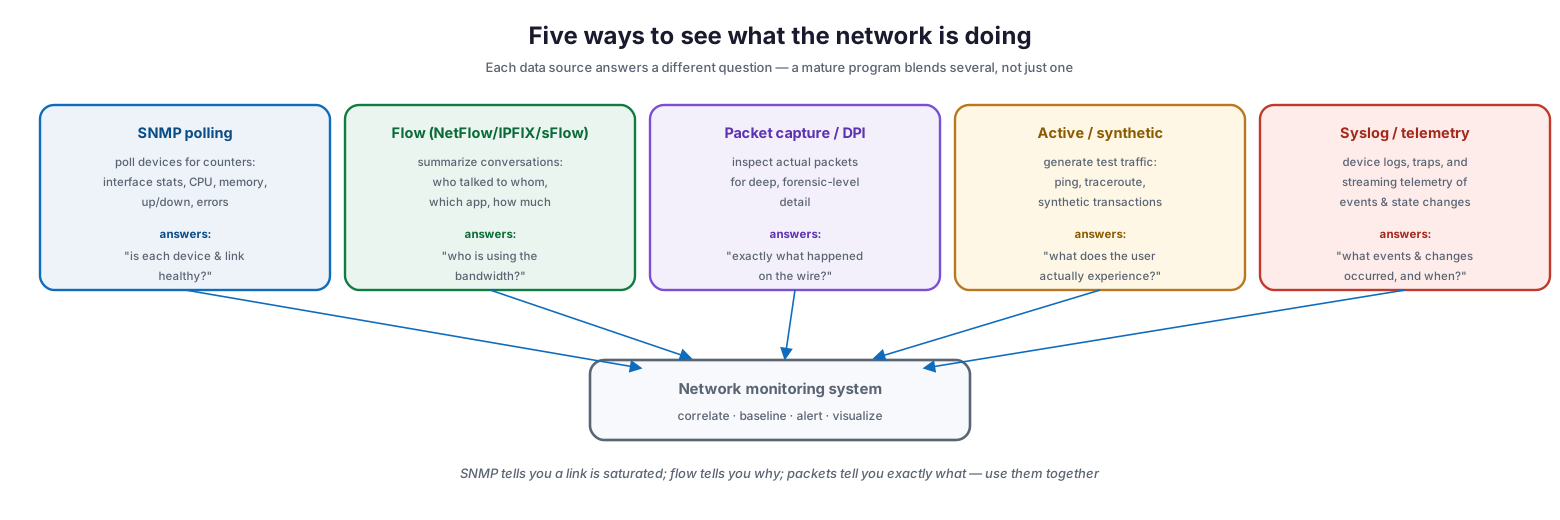
You cannot manage what you cannot see, and there is no single vantage point that reveals everything. A mature program blends several data sources, each of which answers a distinct question.
Five ways to see what the network is doing
SNMP polling queries devices on a schedule for counters — interface statistics, CPU and memory, up/down status, error counts — and answers “is each device and link healthy?” Flow monitoring, using protocols such as NetFlow, IPFIX, or sFlow, summarizes conversations across the network — who talked to whom, using which application, and how much data moved — answering “who is using the bandwidth?” Packet capture and deep packet inspection examine the actual packets on the wire for forensic-level detail, answering “exactly what happened?” Active or synthetic monitoring generates its own test traffic — pings, traceroutes, synthetic transactions — to answer “what does the user actually experience?” And syslog and streaming telemetry collect device logs, traps, and state changes to answer “what events occurred, and when?” These layers are complementary: SNMP tells you a link is saturated, flow tells you which application is saturating it, and packet capture tells you precisely what those packets contain.
| Data source | What it collects | Question it answers |
|---|---|---|
| SNMP polling | Device counters, interface stats, status | Is each device and link healthy? |
| Flow (NetFlow/IPFIX/sFlow) | Traffic conversations by source, dest, app | Who is using the bandwidth? |
| Packet capture / DPI | Actual packet contents | Exactly what happened on the wire? |
| Active / synthetic | Test traffic (ping, traceroute, transactions) | What does the user experience? |
| Syslog / telemetry | Logs, traps, state changes | What events and changes occurred? |
The Six Metrics of Network Health
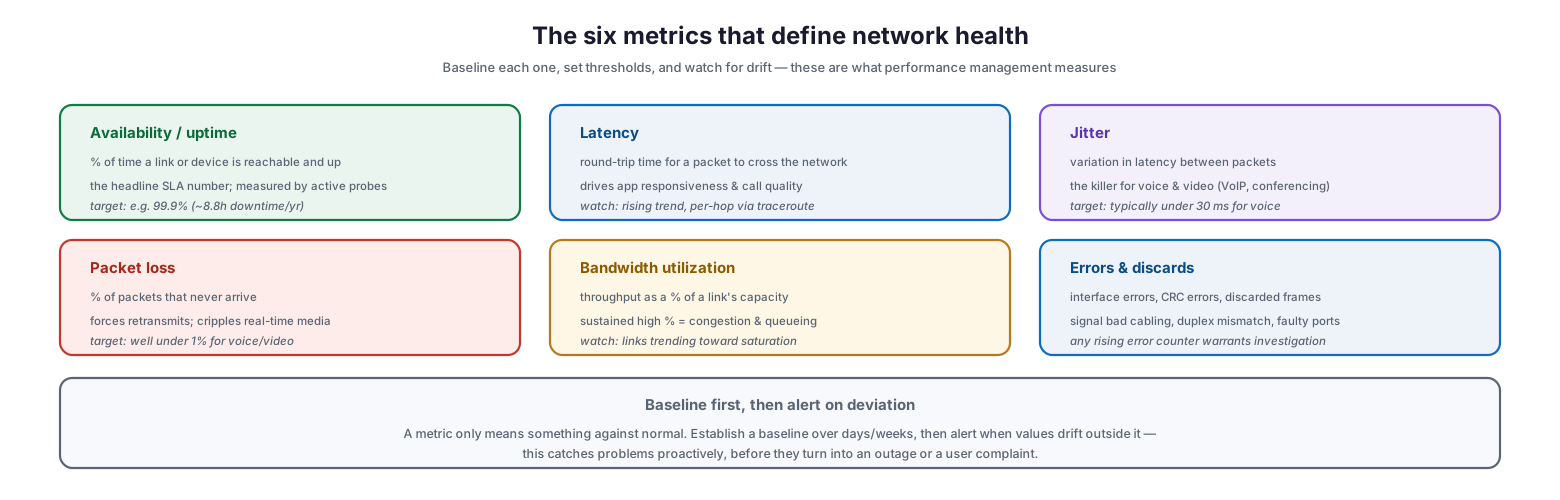
Data sources feed metrics, and a small, universal set of them defines whether a network is healthy. Performance management is, at heart, the practice of baselining these and watching for deviation.
The six metrics that define network health
Availability — the percentage of time a link or device is reachable — is the headline number behind most service-level agreements, measured by active probes. Latency, the round-trip time for a packet to cross the network, drives application responsiveness and call quality. Jitter, the variation in latency between packets, is the silent killer of voice and video, where an uneven stream matters more than a slow one. Packet loss, the percentage of packets that never arrive, forces retransmissions and cripples real-time media. Bandwidth utilization, throughput as a percentage of a link’s capacity, warns of the congestion and queueing that appear as links approach saturation. And errors and discards — interface errors, CRC errors, dropped frames — expose bad cabling, duplex mismatches, and failing ports. The essential discipline is that no metric means anything in isolation: you establish a baseline of normal over days or weeks, then alert on deviation from it, which is what turns monitoring from reactive to proactive.
| Metric | What it measures | Why it matters | Typical target |
|---|---|---|---|
| Availability | % time reachable/up | The core SLA number | 99.9%+ for critical links |
| Latency | Round-trip packet time | App responsiveness, call quality | Low and stable; app-dependent |
| Jitter | Variation in latency | Voice/video quality | Under ~30 ms for voice |
| Packet loss | % packets lost | Retransmits, media quality | Well under 1% for real-time |
| Bandwidth utilization | Throughput vs capacity | Congestion, capacity planning | Watch links trending high |
| Errors & discards | Interface/CRC errors, drops | Physical/config faults | Any rising counter |
Active and Passive Monitoring
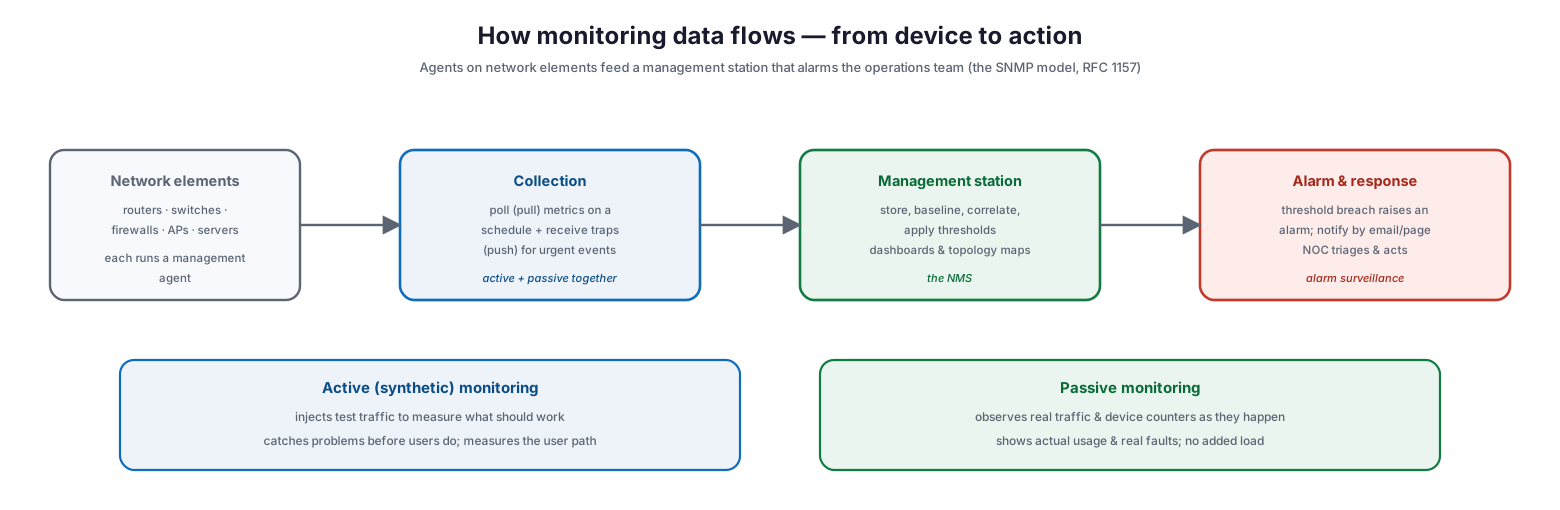
The data that feeds these metrics reaches the monitoring system in two complementary ways, and understanding the flow clarifies how a program is built. In the classic model — formalized by SNMP in the internet standards — network elements such as routers, switches, firewalls, and access points each run a management agent. A management station collects from them, both by polling metrics on a schedule and by receiving traps pushed for urgent events, then stores, baselines, correlates, and applies thresholds. When a threshold is breached, an alarm is raised and the operations team is notified to triage and act.
How monitoring data flows — from device to action
Cutting across this flow is the distinction between active and passive monitoring. Active, or synthetic, monitoring injects test traffic to measure what should work — pinging a site, running a synthetic transaction, tracing a path — which lets it catch problems before users encounter them and measure the actual user path end to end. Passive monitoring observes real traffic and device counters as they happen, showing genuine usage patterns and real faults without adding load to the network. Neither is sufficient alone: passive monitoring tells you what is happening now, while active monitoring tells you whether the experience users depend on is working even when no one happens to be using it. A robust program runs both.
The Maturity Path: Reactive to Predictive
Network monitoring is not a single capability but a journey, and knowing where you are on it helps decide what to build next.
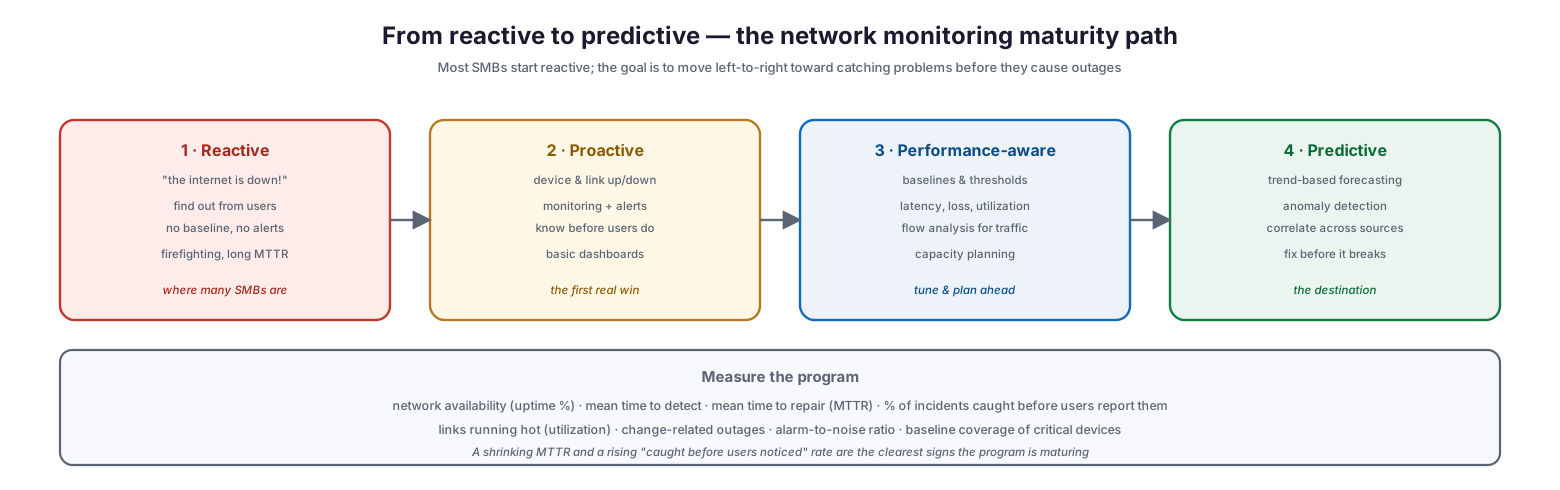
From reactive to predictive — the network monitoring maturity path
Most small businesses begin reactive: they learn the network is down when users complain, have no baseline and no alerts, and spend their time firefighting with a long mean-time-to-repair. The first real win is becoming proactive — monitoring device and link up/down status with alerts, so IT knows about problems before users do, backed by basic dashboards. From there, a performance-aware program adds baselines and thresholds for latency, loss, and utilization, uses flow analysis to understand traffic, and plans capacity ahead of need. The destination is predictive operations: trend-based forecasting, anomaly detection, and correlation across data sources that surface problems before they cause an outage at all. Progress along this path is measurable, and the clearest signs of maturity are a shrinking mean-time-to-repair and a rising share of incidents caught before any user reports them.
| Stage | Characteristic | Typical capability |
|---|---|---|
| Reactive | Learn of issues from users | No baseline, no alerts, firefighting |
| Proactive | Know before users do | Up/down monitoring, alerts, dashboards |
| Performance-aware | Tune and plan ahead | Baselines, thresholds, flow analysis, capacity planning |
| Predictive | Fix before it breaks | Forecasting, anomaly detection, cross-source correlation |
Network Monitoring Checklist
- Inventory every network element — routers, switches, firewalls, access points, and critical servers — and bring each under monitoring.
- Enable SNMP polling for device and interface health across the estate.
- Add flow monitoring (NetFlow/IPFIX/sFlow) to understand who and what is using bandwidth.
- Deploy active/synthetic checks for critical paths and services to measure the user experience.
- Collect syslog and traps centrally so events and changes are captured and searchable.
- Establish baselines for availability, latency, jitter, packet loss, utilization, and errors before setting alerts.
- Set thresholds against those baselines and route alarms to the right people by severity.
- Track configuration changes; correlate outages with recent changes.
- Monitor link utilization for capacity planning, not just faults.
- Build topology-aware dashboards so a fault’s blast radius is visible at a glance.
- Measure the program: availability, mean-time-to-detect, mean-time-to-repair, and incidents caught before users report them.
- Feed security alarms into the same surveillance process as faults.
Best Practices
Baseline before you alert. A number only becomes a signal when compared to normal. Spend the first days or weeks establishing baselines for each key metric, then alert on deviation — this is what makes monitoring proactive instead of noisy.
Blend your data sources. No single source sees everything. Combine SNMP for health, flow for traffic, synthetic tests for user experience, and packet capture for deep dives, so you can move from “something is wrong” to “here is exactly what and why.”
Monitor the whole path, not just the boxes. Users experience end-to-end performance, not individual device health. Active, synthetic checks along the paths that matter reveal problems that per-device monitoring misses.
Correlate changes with outages. Because so many incidents follow a configuration change, track changes rigorously and put them side by side with your fault timeline. It is often the fastest route to a root cause.
Route alarms by severity. Not every event deserves a middle-of-the-night call. Tier your alarms so critical faults page a human while informational events land on a dashboard, protecting your team from alert fatigue.
Watch capacity, not just faults. Utilization trends warn of congestion weeks before it degrades service. Use them for planning so you upgrade links ahead of demand rather than after complaints.
Common Mistakes
Monitoring only up/down. Knowing a device is reachable says nothing about whether it is performing. Without latency, loss, and utilization metrics, degraded-but-alive conditions go unseen until users complain.
Alerting without baselines. Static thresholds pulled from thin air produce false alarms and missed problems. Baseline normal first, then alert on meaningful deviation.
Relying on a single data source. SNMP alone cannot tell you which application is saturating a link, and flow alone cannot tell you a device has failed. One lens leaves blind spots.
Ignoring configuration changes. Treating monitoring and change management as separate disciplines means repeatedly rediscovering that “someone changed something.” Link them.
Drowning in alarms. Unfiltered, un-tiered alerts create fatigue, and a fatigued team misses the alarm that matters. Prioritize by severity and suppress noise.
Forgetting the user experience. Device-centric monitoring can show everything “green” while users suffer. Synthetic, path-based checks close that gap.
Frequently Asked Questions
What is FCAPS? FCAPS is the ISO/ITU-T model for network management, dividing it into five areas: Fault, Configuration, Accounting (or Administration), Performance, and Security. Network monitoring lives mainly in the Fault and Performance areas but a complete program addresses all five.
What is the difference between SNMP and flow monitoring? SNMP polls devices for health metrics like interface stats and status, answering whether a device or link is healthy. Flow monitoring (NetFlow, IPFIX, sFlow) summarizes traffic conversations, answering who and what is consuming bandwidth. They are complementary.
What metrics should I monitor first? Start with availability, latency, packet loss, and bandwidth utilization on your critical links and devices, plus interface errors. Add jitter where voice or video quality matters. Baseline each before setting alerts.
What is the difference between active and passive monitoring? Passive monitoring observes real traffic and device counters as they occur; active (synthetic) monitoring injects test traffic to measure what should work. Passive shows what is happening now; active catches problems before users do and measures the user path. Use both.
How do I make monitoring proactive rather than reactive? Move up the maturity path: add up/down alerting so you know before users do, then baselines and thresholds for performance, then trend-based forecasting. The measure of progress is a falling mean-time-to-repair and more incidents caught before users report them.
Why do so many outages follow a change? Configuration changes, software updates, and hardware swaps are among the most common triggers of network problems. That is why configuration management and change tracking are core to FCAPS — correlating outages with recent changes is often the fastest path to a fix.
Conclusion
A well-monitored network is the difference between vague, painful outages and problems that are seen, understood, and resolved before they spread. The FCAPS framework maps the full scope of the work, the five data sources reveal what the network is doing from complementary angles, and the six health metrics — availability, latency, jitter, packet loss, utilization, and errors — tell you at any moment whether the network is well. Baseline those metrics, blend active and passive monitoring, and route alarms intelligently, and a growing business gains visibility that once required an enterprise operations center.
The path forward is incremental and rewarding. Begin by bringing every device under basic up/down monitoring so you learn of problems before your users do, then add baselines, flow analysis, and synthetic checks to become genuinely performance-aware, and aim ultimately at predictive operations that catch issues before they cause an outage. Measure mean-time-to-repair and the share of incidents caught proactively, and let those numbers guide the investment. Do that, and the network stops being the mysterious source of vague complaints and becomes a well-understood, reliably observed foundation the whole business can depend on.
References
- FCAPS — ISO/ITU-T network management model (overview)
- ITU-T M.3400 — TMN Management Functions
- RFC 1157 — A Simple Network Management Protocol (SNMP)
- RFC 7011 — Specification of the IP Flow Information Export (IPFIX) Protocol
- RFC 3954 — Cisco Systems NetFlow Services Export Version 9
- ITU-T X.733 — Systems Management: Alarm reporting function
- NIST SP 800-137 — Information Security Continuous Monitoring