IT KPIs Every CIO Should Track
Ask most IT departments how they’re doing, and you’ll get a number: tickets closed this month, hours logged, projects in flight.
- Content owner
- Insyto Content Team
- Editorial reviewer
- Ritesh Mhatre
- Technical reviewer
- Navish Ansari
- Next review
- To be scheduled
- Last reviewed
- Review pending
- Technical level
- Beginner · CIOs, CTOs, IT directors
IT Metrics · Executive & Business Topics
Executive Summary
Ask most IT departments how they’re doing, and you’ll get a number: tickets closed this month, hours logged, projects in flight. Ask a CIO what those numbers mean for the business, and the answer often gets vague. IT KPIs — key performance indicators — exist to close that gap. Done well, they translate day-to-day IT activity into the handful of numbers that tell leadership whether technology is reducing risk, controlling cost, and delivering on schedule.
The stakes are real. Without the right KPIs, IT looks busy without anyone being able to say whether it’s effective — spend goes unquestioned until a budget crunch, security posture drifts until an incident, and delivery slips until a project is visibly late. With the right KPIs, the same information is visible early enough to act on, in a form leadership can actually use to make decisions. The hard part isn’t measuring more; it’s measuring the right handful of things and reviewing them on a fixed cadence.
This guide is a vendor-neutral walkthrough of IT KPIs. It defines what separates a business-aligned KPI from an activity metric, explains how KPIs should connect operations to outcomes, sets out the factors that should determine which ones to track, and provides the ownership, category, and core scorecard tables a CIO needs to build and govern IT reporting. It is deliberately technology-agnostic — the approach applies whatever platforms and vendors an organization runs — and focuses on the measurement discipline rather than any particular tool.
Who should read this:
- CIOs, CTOs, and IT directors building or refining an IT scorecard
- Business owners and operators evaluating IT performance
- Finance leaders assessing IT cost and efficiency
- Board members and investors evaluating technology risk and delivery
What separates a KPI from an activity metric?
Not every number IT reports is a KPI. A KPI is a metric with a target, a trend, and a clear link to a business outcome — not just a count of what happened.
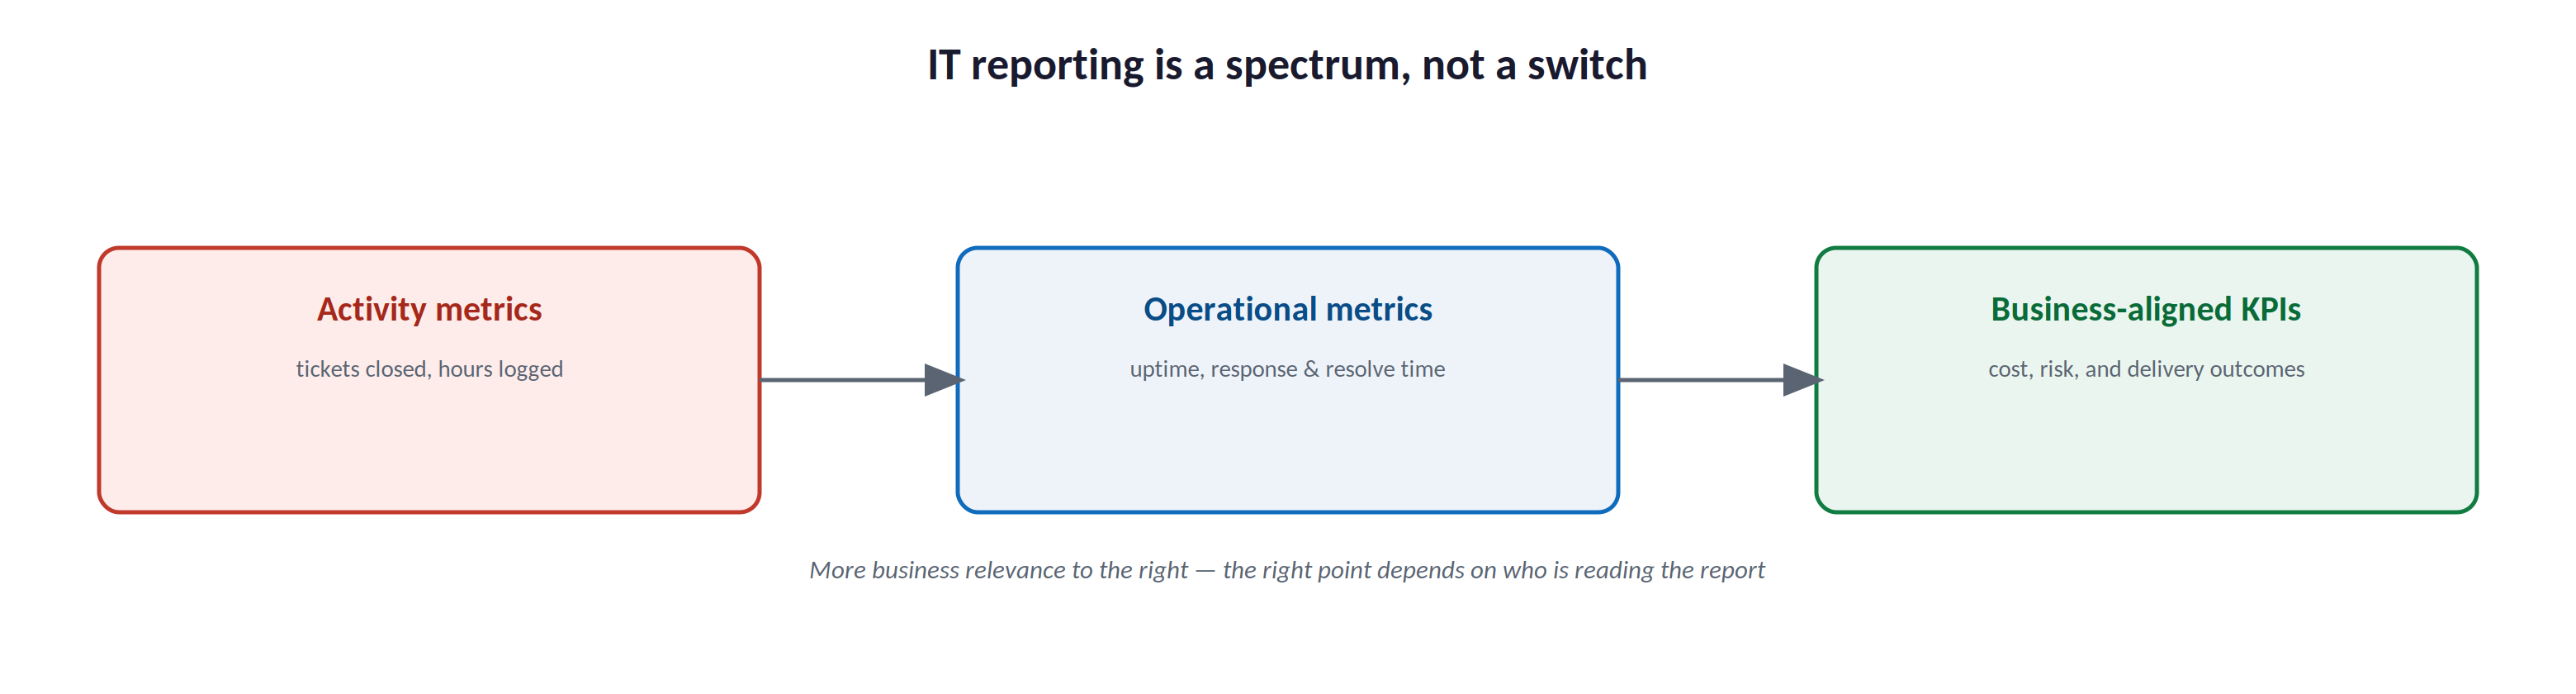
IT reporting is a spectrum, not a switch: from activity metrics like tickets closed and hours logged, to operational metrics like uptime and response and resolve time, to business-aligned KPIs that measure cost, risk, and delivery outcomes — more business relevance to the right, with the right point depending on who is reading the report.
Most IT reporting starts at the activity end of this spectrum: counts of tickets, hours, or projects that describe volume but say nothing about outcomes. Many organizations move one step further and track operational metrics like uptime and resolution time — useful, but still describing how IT is performing on its own terms rather than the business’s. True KPIs go further: they’re chosen because they answer a question leadership actually has — is risk going up or down, is cost under control, is the roadmap on track — and tracked with a target so a number alone doesn’t need interpretation. None of these levels is worthless; activity metrics still help IT manage its own workload. But the further right the reporting sits, the more useful it is to anyone outside IT.
What changes when you track the right KPIs?
The practical effect of the right scorecard isn’t more reporting — it’s reporting leadership can actually use to make decisions.
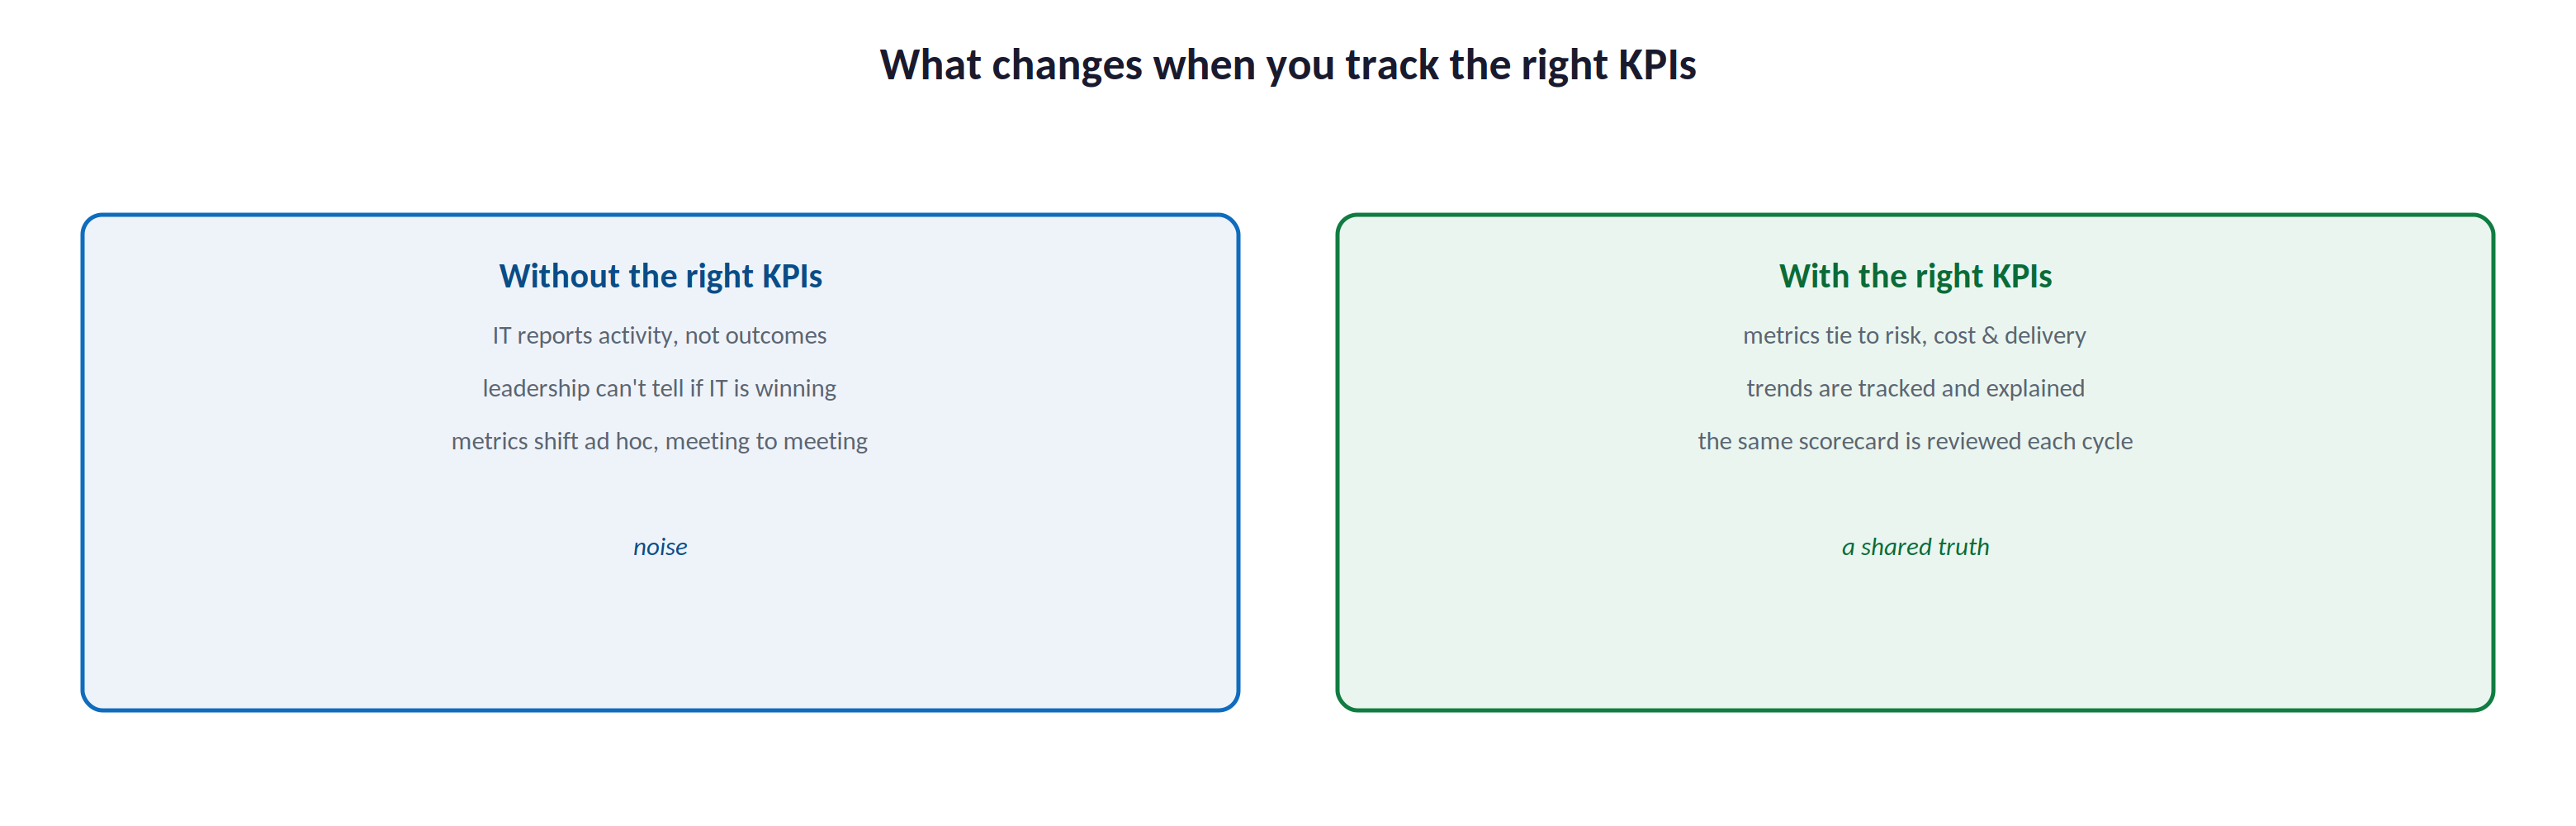
What changes when you track the right KPIs: without them, IT reports activity, not outcomes, leadership can’t tell if IT is winning, and metrics shift ad hoc, meeting to meeting — noise; with them, metrics tie to risk, cost, and delivery, trends are tracked and explained, and the same scorecard is reviewed each cycle — a shared truth.
Without the right KPIs, every report is a fresh negotiation over what to measure, and leadership has no consistent way to judge whether IT performance is improving or declining. A high ticket count could mean the team is responsive, or that something is chronically broken — nobody can tell from the number alone. With the right KPIs, the same handful of metrics gets reviewed every cycle, trends are visible instead of hidden in a single snapshot, and a rising or falling number means something specific to risk, cost, or delivery that leadership can act on.
How do KPIs connect operations to outcomes?
KPIs are the translation layer between what IT does every day and what the business actually needs to know.
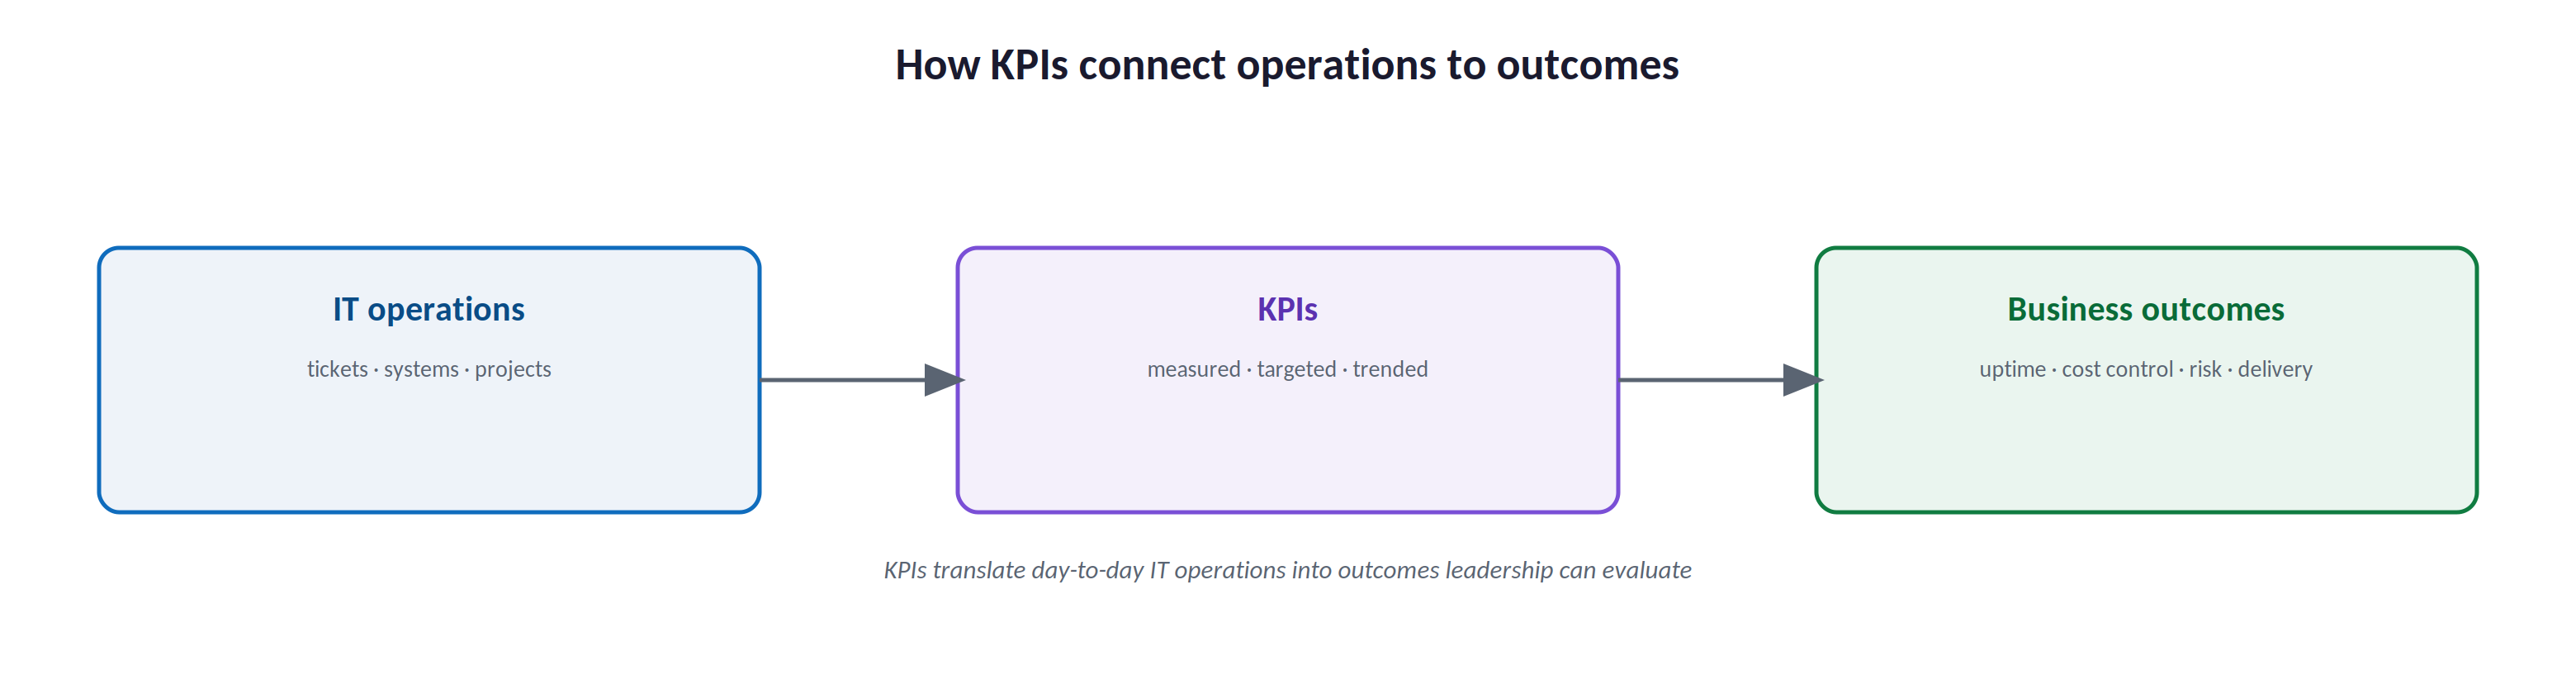
How KPIs connect operations to outcomes: IT operations — tickets, systems, projects — are measured, targeted, and trended into KPIs, which in turn represent business outcomes: uptime, cost control, risk reduction, and delivery. KPIs translate day-to-day IT operations into outcomes leadership can evaluate.
IT operations generate enormous amounts of raw data — every ticket, every system log, every project update. Almost none of that data is directly useful to a board or an executive team on its own. KPIs are the deliberate compression of that raw operational data into a small number of measured, targeted, trended figures that map to outcomes non-technical leaders can evaluate: is the business more or less exposed to risk, is spend under control, is delivery on schedule. Skip this translation layer and IT ends up reporting activity that nobody outside IT can interpret.
What determines which KPIs to track?
The right KPI set follows from an honest look at four dimensions of business impact, not from whatever’s easiest to pull out of a dashboard.
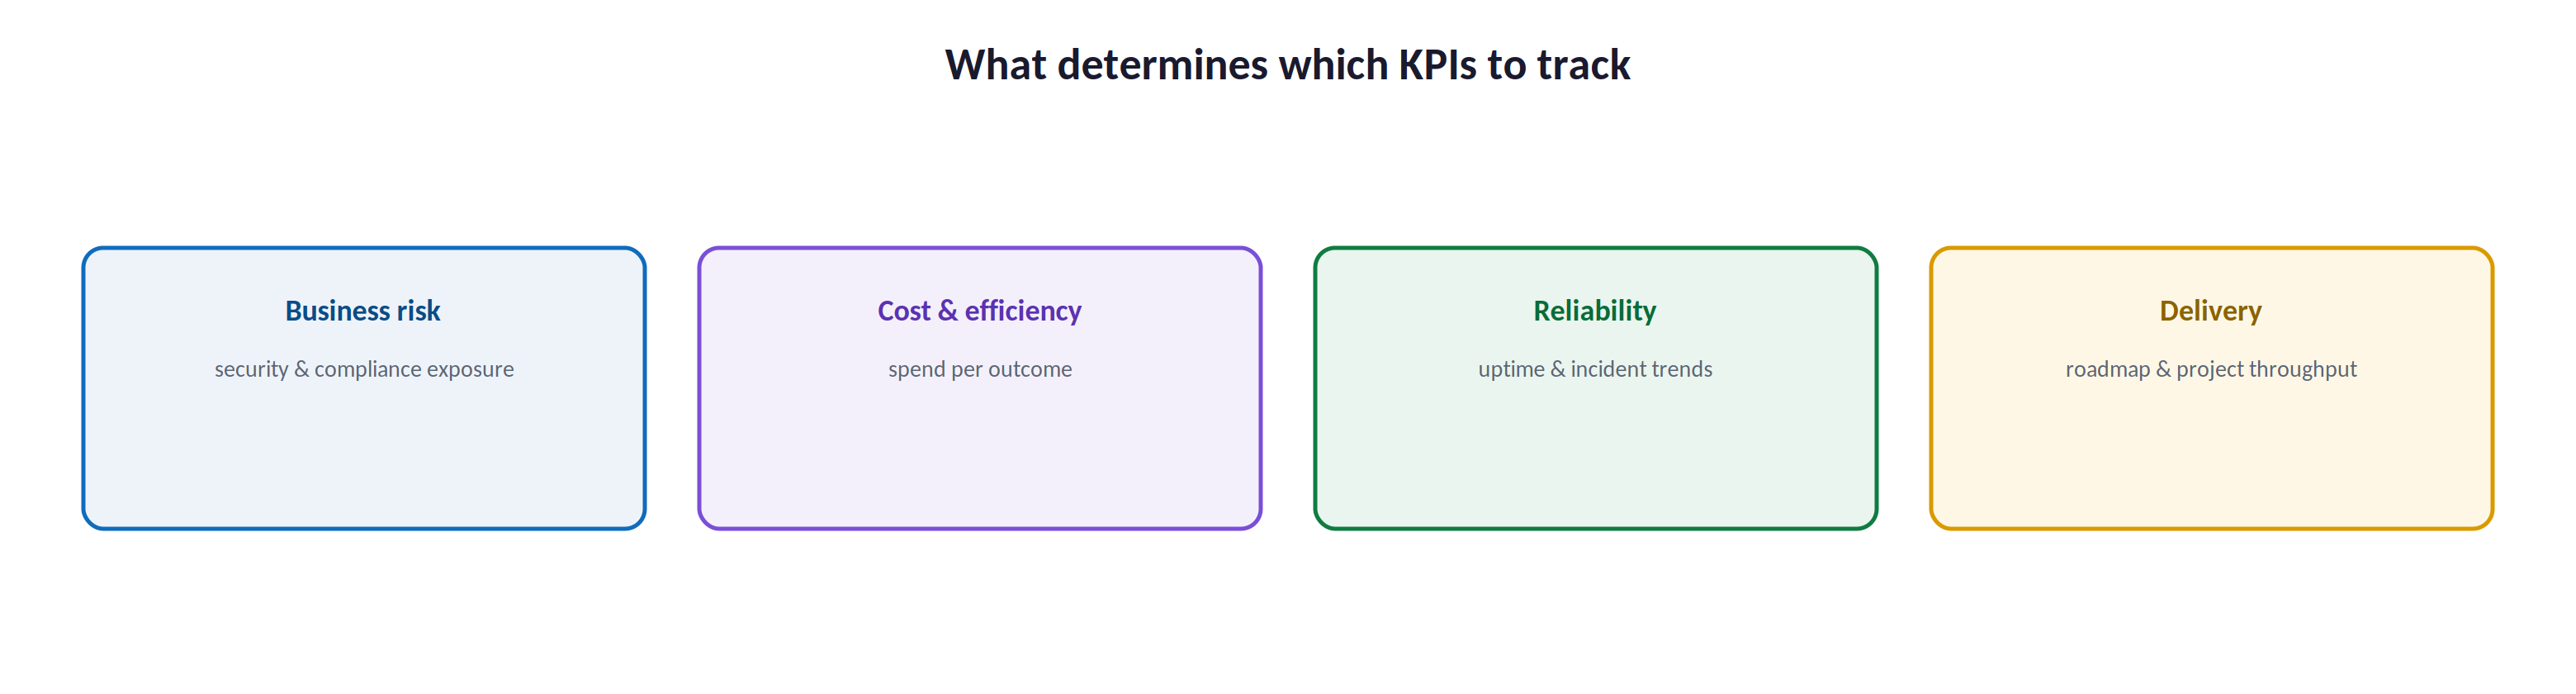
What determines which KPIs to track: business risk (security and compliance exposure), cost and efficiency (spend per outcome), reliability (uptime and incident trends), and delivery (roadmap and project throughput).
The first dimension is business risk — security and compliance exposure carries consequences serious enough that it deserves its own tracked metrics regardless of industry. The second is cost and efficiency: what the business is spending relative to what it’s getting, not just a total dollar figure. The third is reliability — the uptime and incident trends that determine whether the business can count on its systems day to day. The fourth is delivery: whether planned initiatives are actually landing on schedule. A scorecard built around all four gives leadership a complete picture; one that only covers uptime, or only covers cost, leaves blind spots that eventually surface as a problem nobody saw coming.
How is a KPI scorecard implemented in practice?
Standing up a KPI scorecard is a repeatable cycle, not a one-time reporting exercise, and it works best when it’s reviewed on a fixed schedule rather than assembled fresh each time.
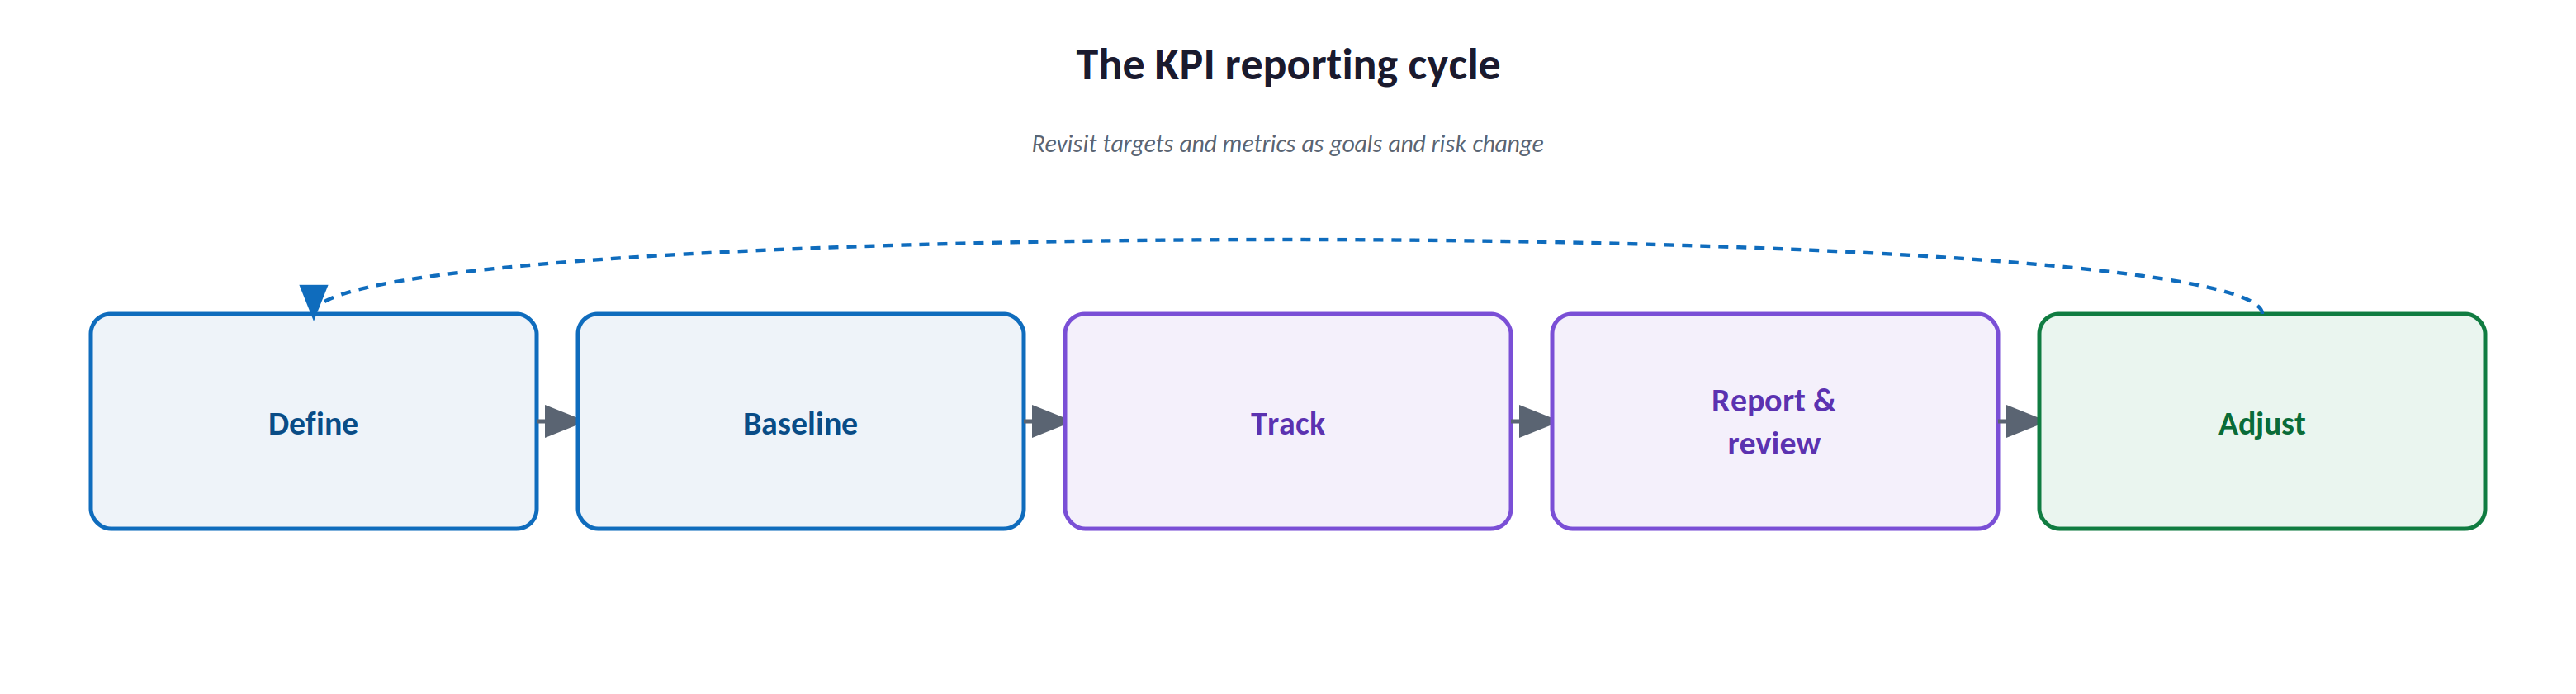
The KPI reporting cycle: define the metrics that matter, establish a baseline, track continuously, report and review on a fixed cadence, and adjust — looping back to define as goals and risk change. Revisit targets and metrics as goals and risk change.
The cycle starts with definition: selecting a small set of KPIs tied to business risk, cost, reliability, and delivery, rather than whatever a dashboard happens to surface. Baselining establishes where those metrics stand today, since a target without a starting point is just a guess. Tracking instruments the relevant systems so data updates continuously rather than being manually compiled each time. Reporting and review presents the scorecard on a fixed cadence and discusses what the trends mean, not just what the numbers are. Adjustment closes the loop, revising targets or swapping out metrics as business goals, budget, or risk exposure change — because a scorecard frozen in place eventually stops measuring what actually matters.
Activity metrics vs business-aligned KPIs at a glance
The comparison below summarizes the practical differences that most influence how IT reporting actually gets used.
| Dimension | Activity metrics | Business-aligned KPIs |
|---|---|---|
| What they measure | Volume of IT activity (tickets, hours) | Business outcomes (risk, cost, delivery, uptime) |
| Audience | IT team, useful for workload management | Leadership and board, useful for decisions |
| Trend visibility | Rarely tracked over time | Tracked and trended quarter over quarter |
| Link to strategy | None | Directly tied to roadmap and risk posture |
| Decision value | Tells you IT is busy | Tells you IT is effective |
| Main risk | Looks productive while missing outcomes | Requires more discipline to define and maintain |
| Review cadence | Ad hoc, if at all | Fixed, typically monthly or quarterly |
| Scales by | Counting more activity | Refining targets against the same framework |
KPI governance: ownership, categories, and the core scorecard
A KPI program only stays useful if it’s governed the way a CIO needs to evaluate it — who is responsible, what the metric is for, the cadence, the risk if it lapses, and the business value it protects. The tables below frame a typical program where business leadership and IT share ownership; in a fully outsourced arrangement, the provider or vCIO carries the Responsible role across most rows.
Responsibility matrix (RACI)
| KPI function | Activity | Responsible | Accountable | Consulted | Informed | Tooling category | Business impact |
|---|---|---|---|---|---|---|---|
| KPI selection | Choose metrics tied to business goals | vCIO | CIO | Department heads, finance | Board | Strategy / roadmap | Metrics that matter |
| Baseline & targets | Set starting values and target ranges | IT / provider | CIO | Finance | Executive team | Reporting / dashboards | Realistic benchmarks |
| Data collection | Instrument systems to capture metrics | IT / provider | CIO | Security | vCIO | RMM / ITSM / SIEM | Accurate, timely data |
| Reporting | Produce the scorecard on a fixed cadence | vCIO | CIO | Department heads | Board | Reporting / dashboards | Consistent visibility |
| Review & interpretation | Discuss trends and decide on action | CIO / vCIO | CEO / exec sponsor | Department heads | Board | Reporting / BI | Informed decisions |
| Target adjustment | Revise targets as goals or risk change | vCIO | CIO | Finance | Board | Strategy / roadmap | KPIs stay relevant |
KPI category matrix
| Category | KPI examples | Description | Tooling category | Cadence | Risk if missing |
|---|---|---|---|---|---|
| Availability & reliability | Uptime %, MTTR | System availability and recovery speed | RMM / monitoring | Continuous | Undetected downtime trends |
| Security & risk | Patch compliance %, incidents, phishing test failure rate | Exposure and containment effectiveness | SIEM / GRC | Continuous / monthly | Unmanaged security risk |
| Financial | Cost per user, budget variance | Spend efficiency and predictability | Financial planning / PSA | Monthly | Unnoticed cost creep |
| Service & delivery | Ticket resolution time, CSAT, project on-time % | Day-to-day service quality | ITSM / PM tooling | Monthly | Declining service unnoticed |
| Business alignment | Roadmap initiatives delivered %, initiatives mapped to goals % | Strategic execution | Roadmap / strategy | Quarterly | IT drifting from business priorities |
Reporting lifecycle
| Stage | Activity | Outcome | Tooling category | Business impact |
|---|---|---|---|---|
| Define | Select KPIs tied to business goals and risk | Agreed metric set | Strategy / roadmap | Focus on what matters |
| Baseline | Establish current values and target ranges | Documented baseline | Reporting / dashboards | Realistic benchmarks |
| Track | Instrument systems and capture data continuously | Live metric data | RMM / ITSM / SIEM | Accurate visibility |
| Report & review | Present the scorecard and discuss trends | Shared understanding | Reporting / BI | Informed decisions |
| Adjust | Revise targets or metrics as goals change | Updated scorecard | Strategy / roadmap | KPIs stay relevant |
Decision matrix
| Scenario | Recommended approach | Justification | Key consideration |
|---|---|---|---|
| No KPIs tracked yet | Start with a small core set (5–8 metrics) | A short list gets adopted; a long one gets ignored | Cover availability, security, cost, and delivery at minimum |
| Heavy compliance exposure | Weight security & risk KPIs higher | Regulatory and breach risk carries outsized consequences | Track patch compliance and incident trends explicitly |
| Board or investor scrutiny | Report KPIs in business terms with trend lines | Leadership needs trends, not a single snapshot number | Pair each metric with what “good” looks like |
| Rapid growth | Add delivery and capacity KPIs | Growth stresses systems and project throughput differently | Revisit targets quarterly as scale changes |
| Tight budget | Prioritize cost and efficiency KPIs | Budget scrutiny requires visible cost control | Track cost per user or outcome, not just total spend |
| Multiple providers or teams | Standardize one shared scorecard | Prevents each team reporting different, incomparable metrics | Agree on definitions before comparing numbers |
Core IT KPI scorecard
| Metric | Target | Category | Business value |
|---|---|---|---|
| Uptime (core systems) | ≥ 99.9% | Availability & reliability | Minimal business disruption |
| Mean time to resolve (MTTR) | ≤ 4 hours for critical issues | Availability & reliability | Faster recovery, less downtime cost |
| Security patch compliance | ≥ 95% within SLA | Security & risk | Reduced exploitable exposure |
| Security incidents (severity-weighted) | Declining trend | Security & risk | Improving risk posture |
| Budget variance | Within ±10% of plan | Financial | Cost predictability |
| Cost per user / device | Tracked, trending flat or down | Financial | Spend efficiency |
| Ticket resolution time | Meets published SLA ≥ 90% of time | Service & delivery | Reliable day-to-day support |
| End-user satisfaction (CSAT) | ≥ 85% | Service & delivery | Trust in IT service |
| Roadmap initiatives delivered on schedule | ≥ 85% | Business alignment | Predictable execution |
| Initiatives mapped to business goals | 100% | Business alignment | Alignment, not guesswork |
Implementation checklist
- A core set of 5–10 KPIs is defined, spanning availability, security, cost, and delivery
- Each KPI has an agreed target or benchmark, not just a raw number
- Data collection is instrumented so metrics update without manual compilation
- A baseline was established before targets were set
- The scorecard is reported on a fixed cadence (monthly or quarterly)
- Trends are tracked over time, not just point-in-time snapshots
- KPIs are reviewed with leadership in business terms, not technical jargon
- Targets are revisited when business goals, budget, or risk profile change
- One shared scorecard is used across all IT providers and internal teams
- Metrics that no longer inform a decision are retired from the scorecard
Best practices
- Keep the core scorecard short — five to ten metrics leadership will actually read.
- Pair every metric with a target, not just a number with no reference point.
- Track trends over time, not single snapshots that hide direction.
- Choose KPIs that map to business risk, cost, and delivery, not just IT activity.
- Automate data collection so reporting isn’t a manual, error-prone exercise.
- Review the scorecard on a fixed cadence, even when nothing looks alarming.
- Present metrics in business language — cost, risk, and reliability — not jargon.
- Retire metrics that no longer change a decision leadership makes.
Common mistakes
- Reporting activity, like tickets closed, instead of outcomes, like risk reduced.
- Tracking dozens of metrics that dilute attention from the ones that matter.
- Setting targets with no baseline to compare against.
- Reporting a snapshot with no trend, so direction is invisible.
- Letting each provider or team report different, incomparable metrics.
- Reviewing the scorecard only when something has already gone wrong.
- Presenting metrics in technical terms leadership can’t act on.
- Never retiring stale metrics that no longer inform any decision.
Frequently asked questions
What are IT KPIs?
IT KPIs are quantified, targeted metrics that measure whether technology is delivering the outcomes the business needs — reliability, security, cost control, and delivery — rather than simply how busy the IT function is.
How many KPIs should a CIO track?
Most effective scorecards hold five to ten core metrics. More than that dilutes attention; leadership needs a short list, not a database dump.
How are KPIs different from SLAs?
An SLA is a commitment from a provider or team, typically enforceable; a KPI is a broader outcome metric used to evaluate performance and inform decisions, whether or not it’s contractually guaranteed.
How often should the scorecard be reviewed?
Monthly for operational metrics like uptime and ticket resolution, and at least quarterly for strategic metrics like roadmap delivery and cost trends.
Should IT KPIs be different for a small business vs an enterprise?
The categories stay the same — availability, security, cost, delivery — but the targets and level of formality scale with size. A small business might track five metrics informally; a large enterprise needs a governed scorecard with automated reporting.
Who should own IT KPI reporting?
Ownership is typically shared: IT — internal, provider, or both — collects and reports the data, while the CIO or vCIO interprets it, and leadership uses it to inform budget and risk decisions.
Conclusion
IT KPIs are not a dashboard exercise; they’re the discipline of translating everything IT does into the handful of numbers that tell leadership whether technology is doing its job. Done well, a short, targeted, trended scorecard turns IT from a black box into a function leadership can evaluate the same way it evaluates any other part of the business. Done poorly — a long list of activity counts with no targets or trends — it produces plenty of reporting and very little insight.
The path forward is to build the scorecard deliberately: choose a small set of KPIs that span risk, cost, reliability, and delivery, baseline them honestly, instrument the data so it updates without manual effort, and review it on a fixed cadence with the trend, not just the number, front and center. Because the right scorecard reflects a business that keeps changing, the best ones are the ones that get revisited and adjusted, not the ones fixed in place the day they were built.
References
This is a vendor-neutral overview of IT KPI reporting. The following industry sources informed the definitions and comparisons; verify current market specifics independently before making a reporting or governance decision. Source access date: 14 August 2026.
On this page
- Executive Summary
- What separates a KPI from an activity metric?
- What changes when you track the right KPIs?
- How do KPIs connect operations to outcomes?
- What determines which KPIs to track?
- How is a KPI scorecard implemented in practice?
- Activity metrics vs business-aligned KPIs at a glance
- KPI governance: ownership, categories, and the core scorecard
- Responsibility matrix (RACI)
- KPI category matrix
- Reporting lifecycle
- Decision matrix
- Core IT KPI scorecard
- Implementation checklist
- Best practices
- Common mistakes
- Frequently asked questions
- Conclusion
- References